InfoArt.ai Blog
Tips, tutorials, and insights on creating stunning infographics with AI. Learn best practices for data visualization and visual communication.
Featured Article
How to Create a Marketing Infographic That Drives Results
Learn step-by-step how to create compelling marketing infographics that capture attention, communicate your message, and drive measurable results for your campaigns.
Latest Articles
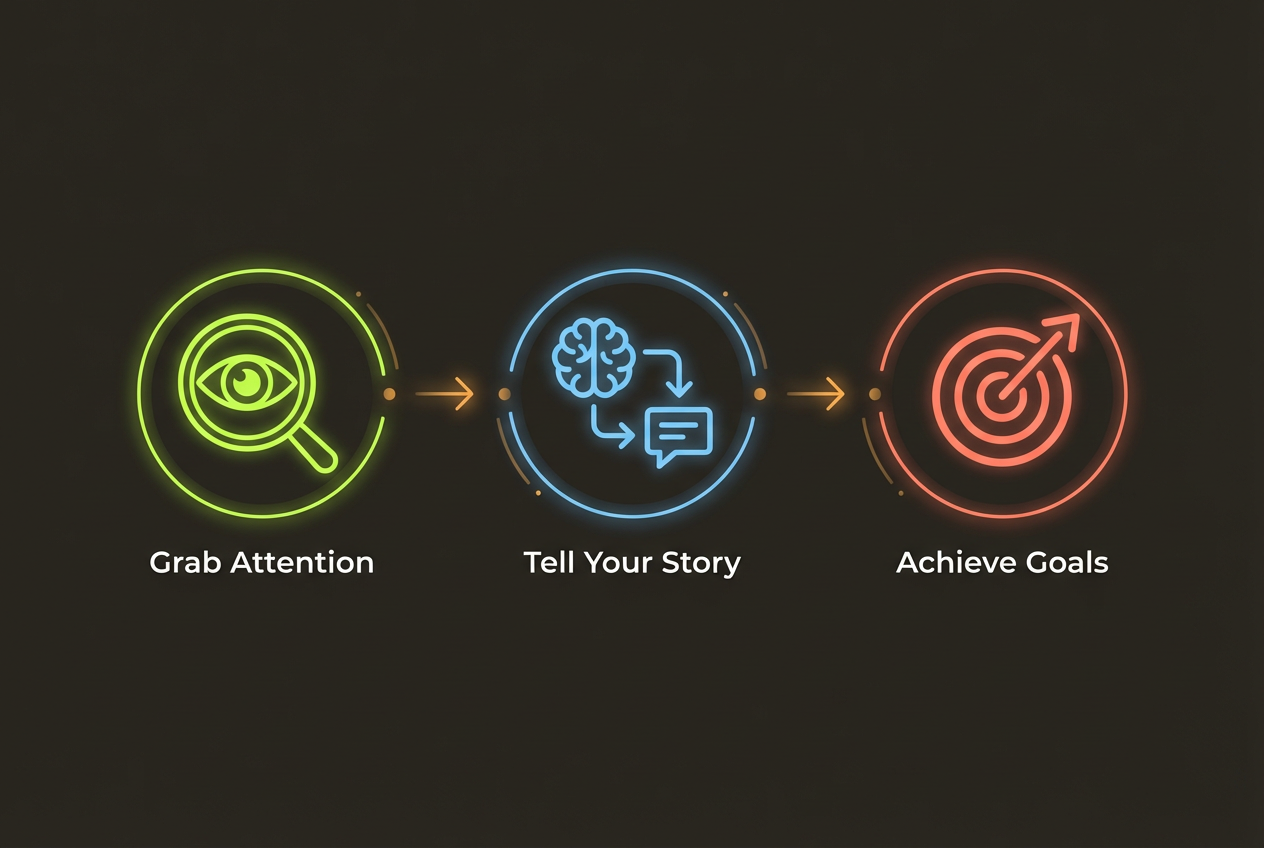
How to Create a Marketing Infographic That Drives Results
Learn step-by-step how to create compelling marketing infographics that capture attention, communicate your message, and drive measurable results for your campaigns.
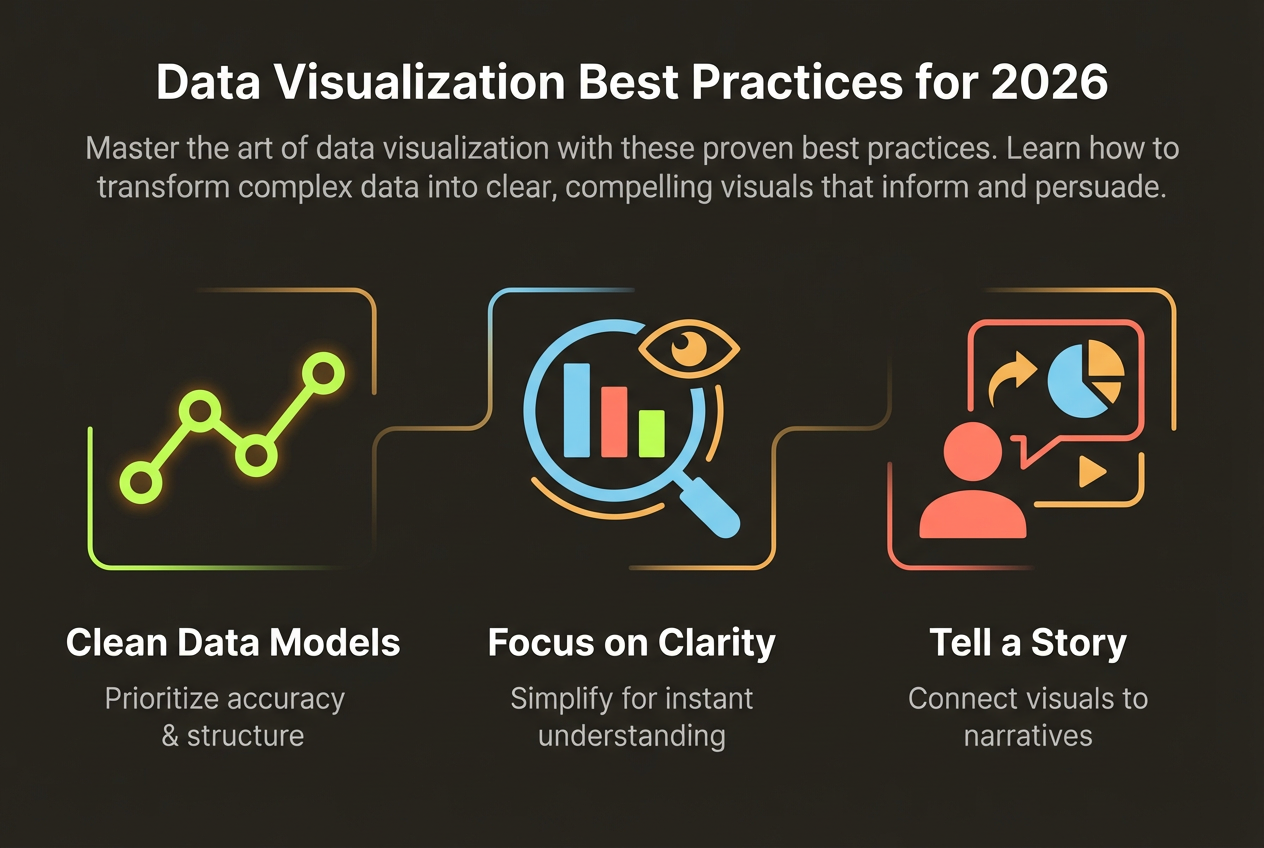
Data Visualization Best Practices for 2026
Master the art of data visualization with these proven best practices. Learn how to transform complex data into clear, compelling visuals that inform and persuade.
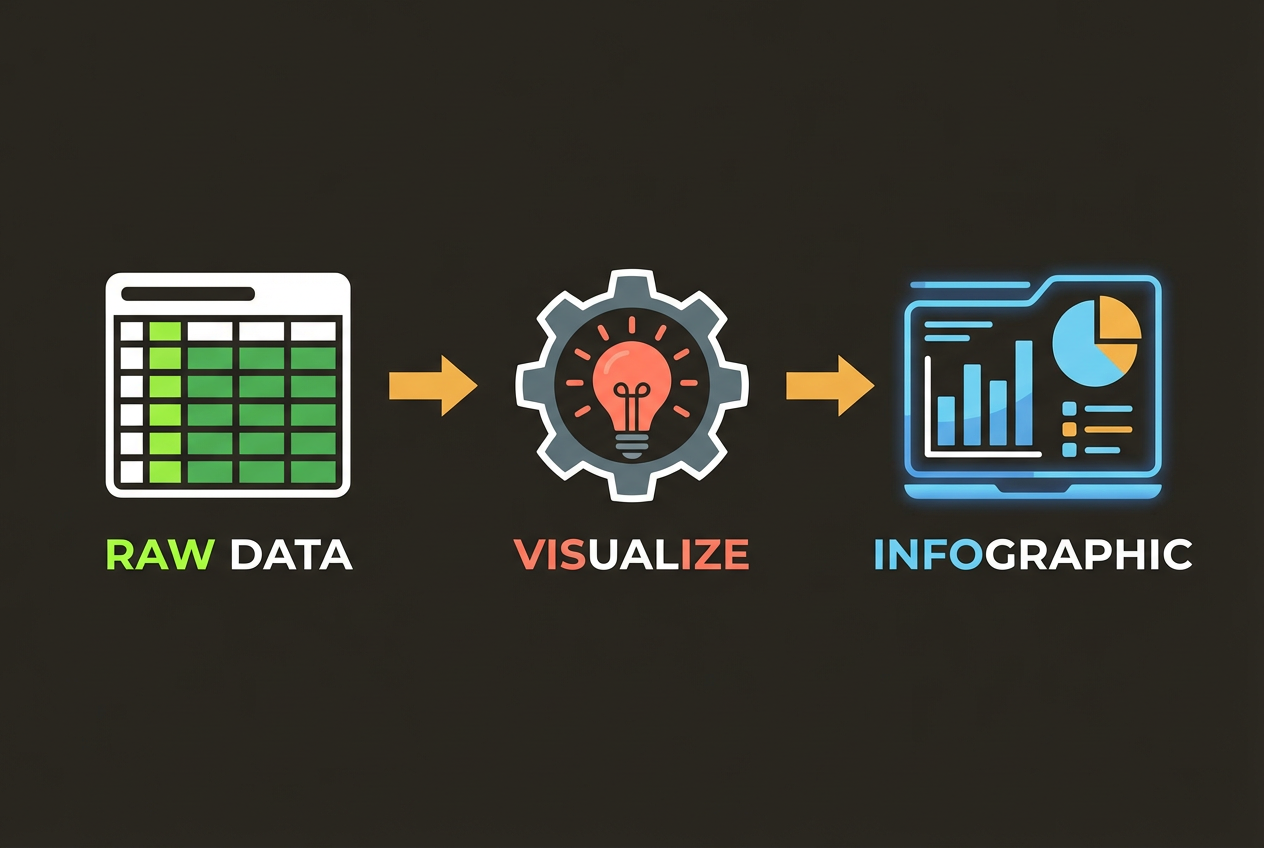
How to Turn Excel Data into Stunning Infographics
Transform your spreadsheet data into compelling visual stories. This step-by-step guide shows you how to go from Excel rows to professional infographics.
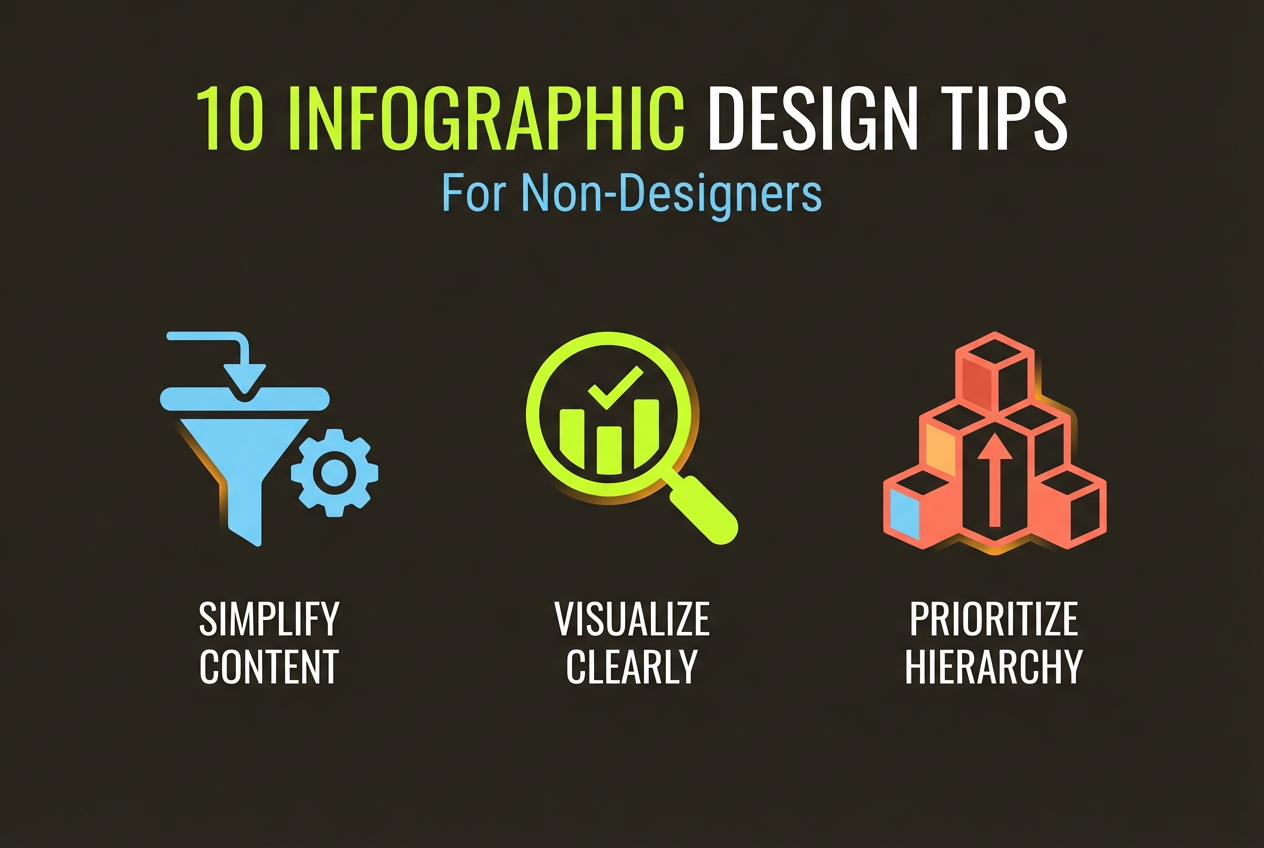
10 Infographic Design Tips for Non-Designers
You don't need to be a designer to create professional infographics. These 10 practical tips will help anyone create visually stunning, effective infographics.
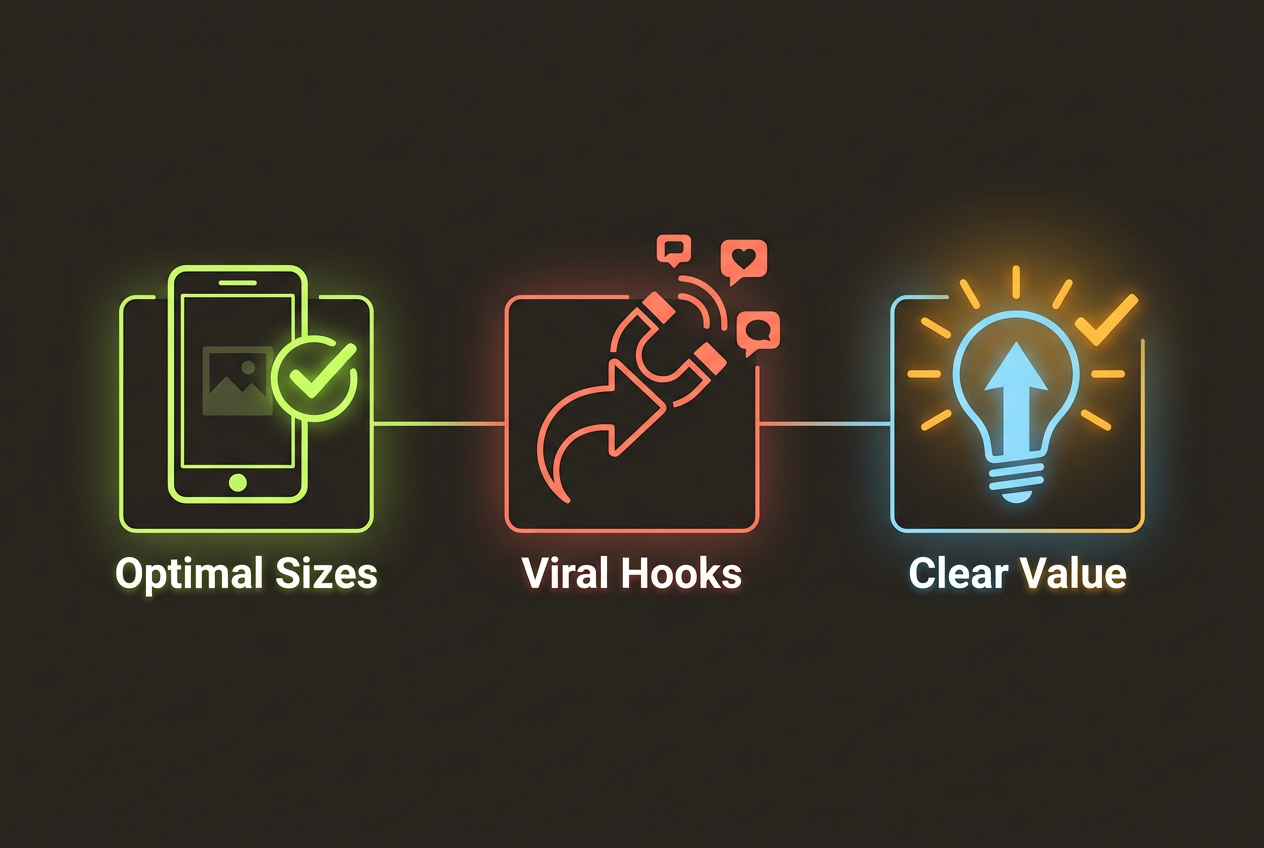
How to Create Social Media Infographics That Get Shared
Learn the secrets to creating infographics that go viral on social media. From optimal dimensions to engagement hooks, this guide covers everything you need.

Healthcare Infographics: Best Practices for Patient Education
Create effective healthcare infographics that educate patients while maintaining compliance. Learn design principles, accessibility requirements, and HIPAA considerations.
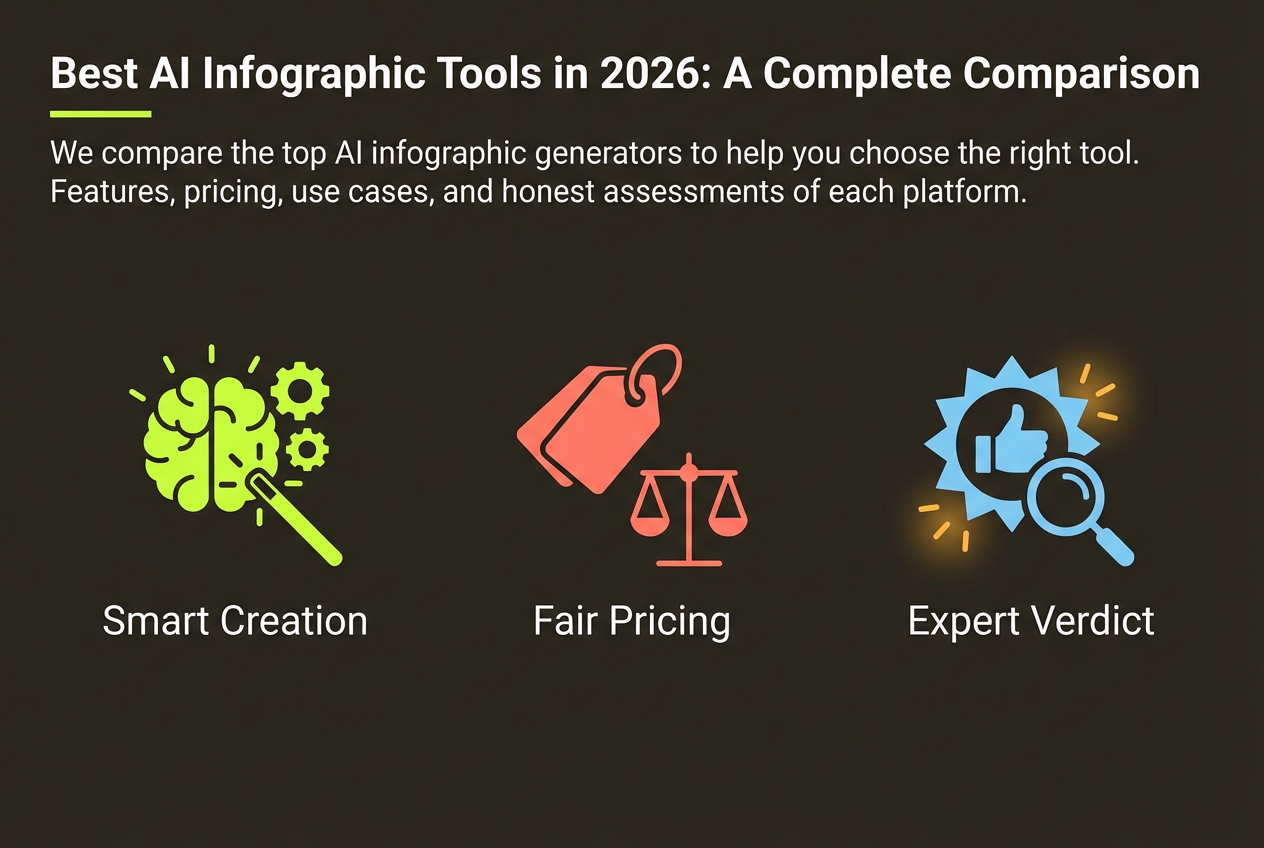
Best AI Infographic Tools in 2026: A Complete Comparison
We compare the top AI infographic generators to help you choose the right tool. Features, pricing, use cases, and honest assessments of each platform.
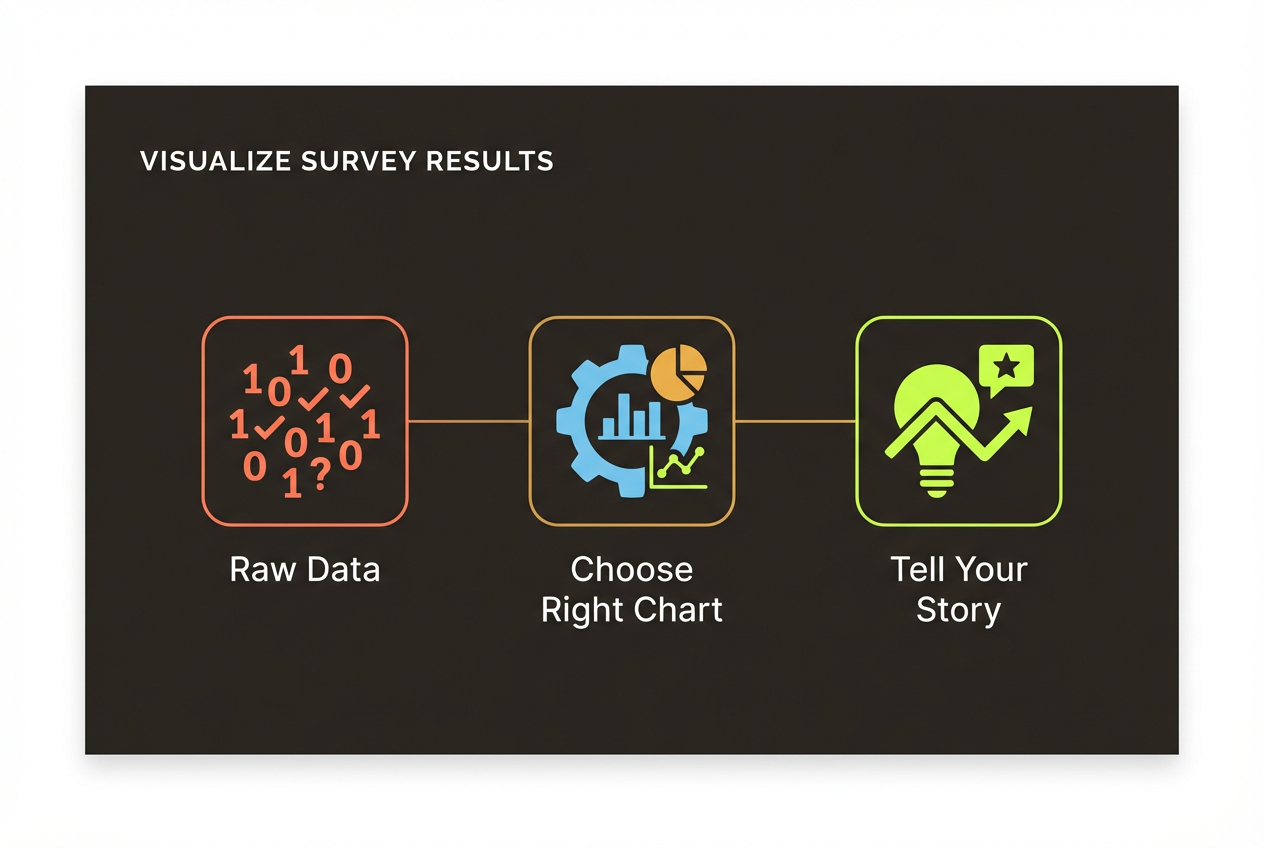
How to Visualize Survey Results: A Complete Guide
Transform raw survey data into compelling visual insights. Learn which chart types work best for different question types and how to tell a story with your findings.
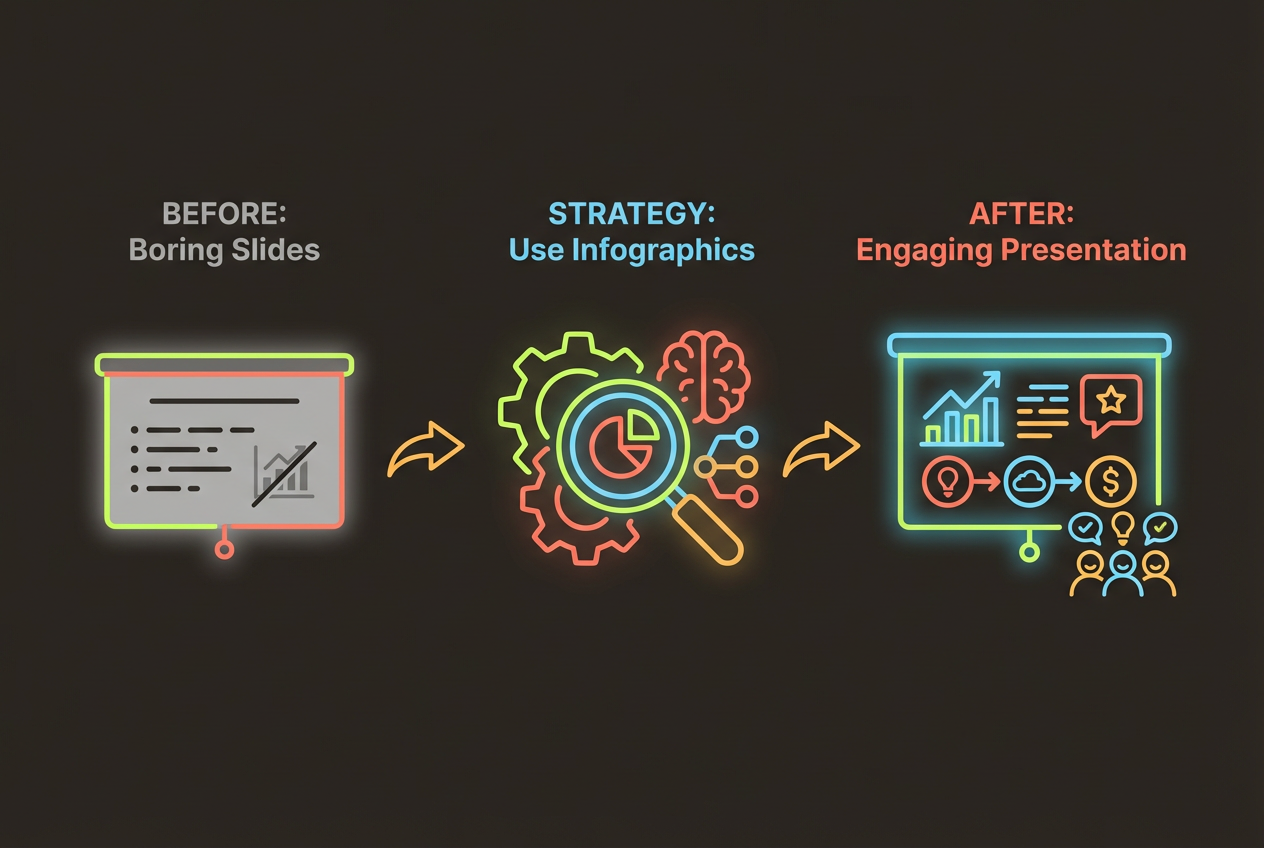
How to Use Infographics in Presentations for Maximum Impact
Transform boring slides into engaging presentations with strategic infographic use. Learn placement, design, and storytelling techniques for business presentations.
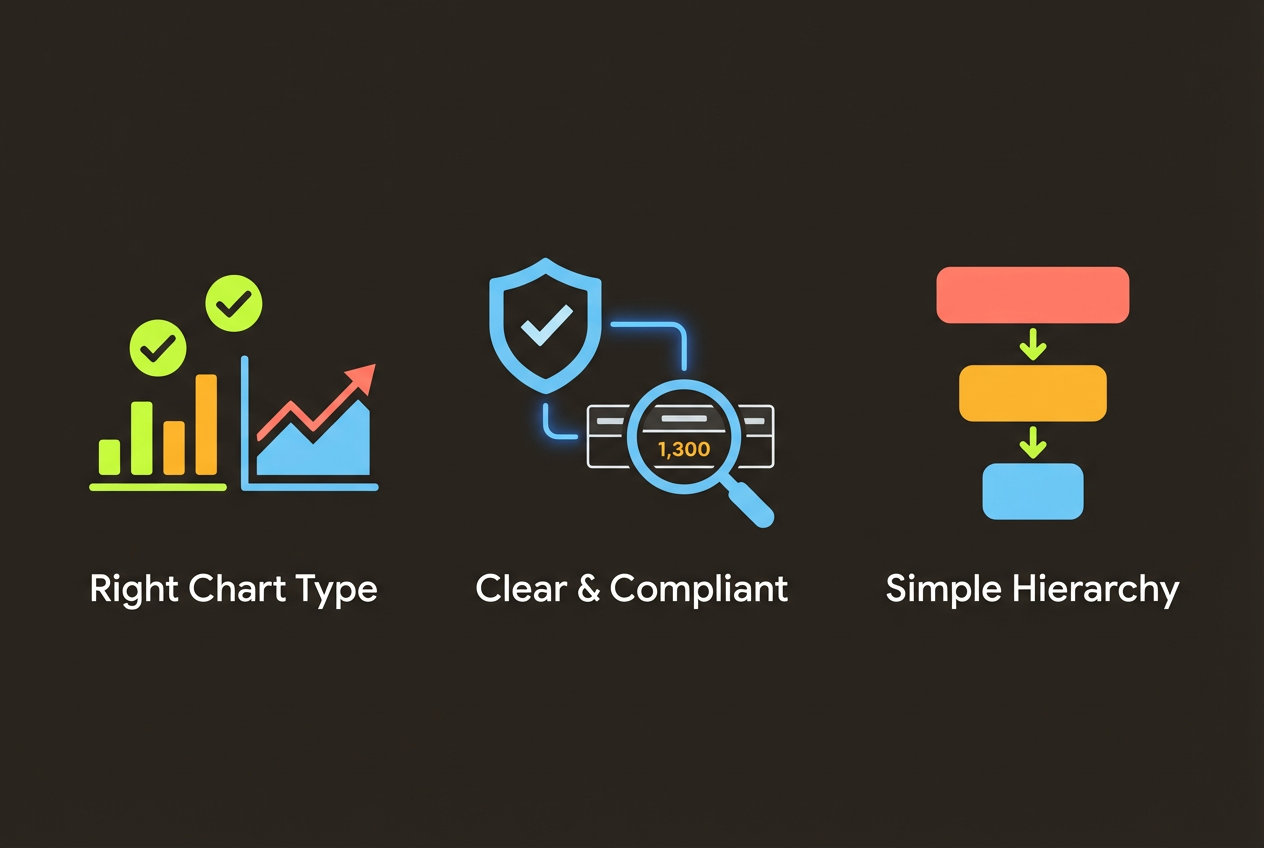
Financial Data Visualization: Best Practices for Reports
Create clear, accurate financial visualizations that inform decisions. Learn chart selection, compliance considerations, and design principles for financial reports.
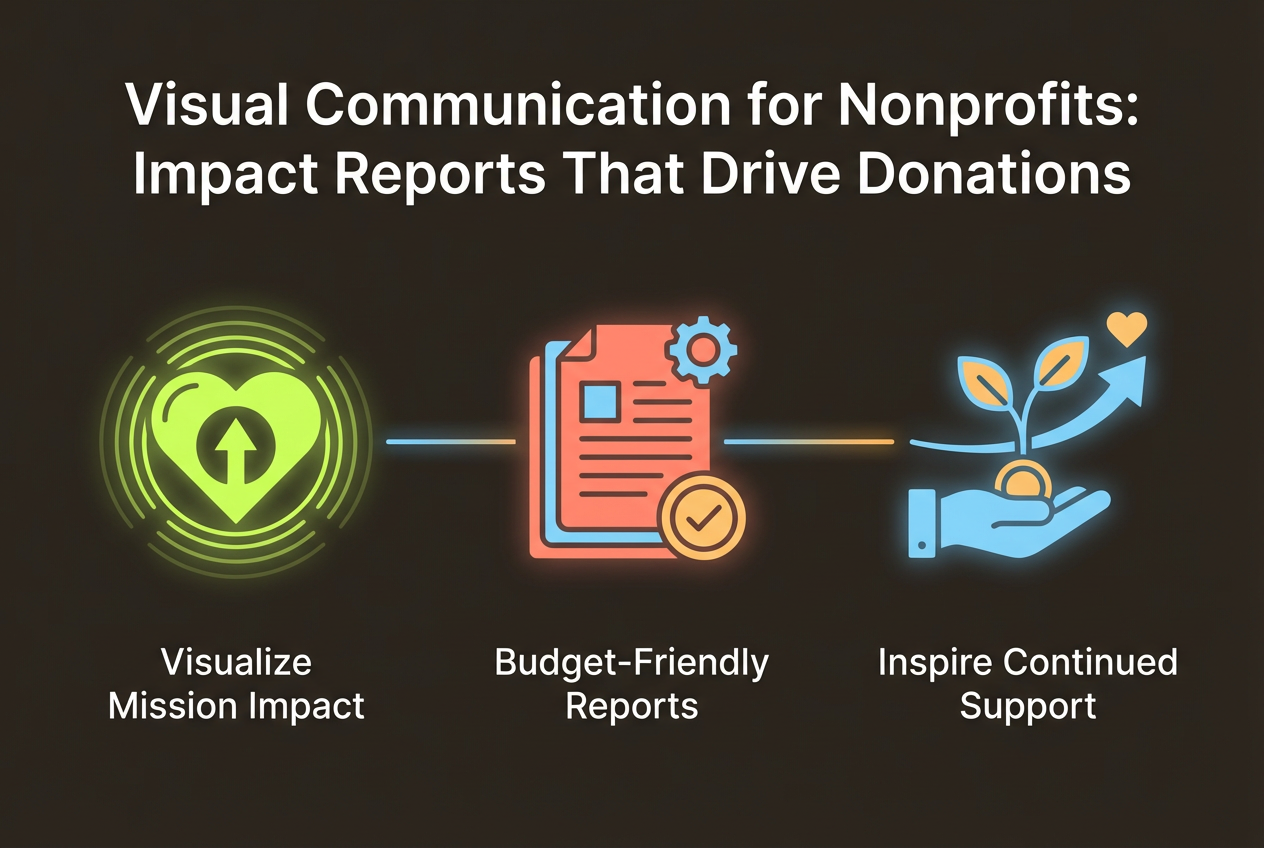
Visual Communication for Nonprofits: Impact Reports That Drive Donations
Create compelling impact reports and donor communications on a nonprofit budget. Learn how to visualize your mission's impact and inspire continued support.
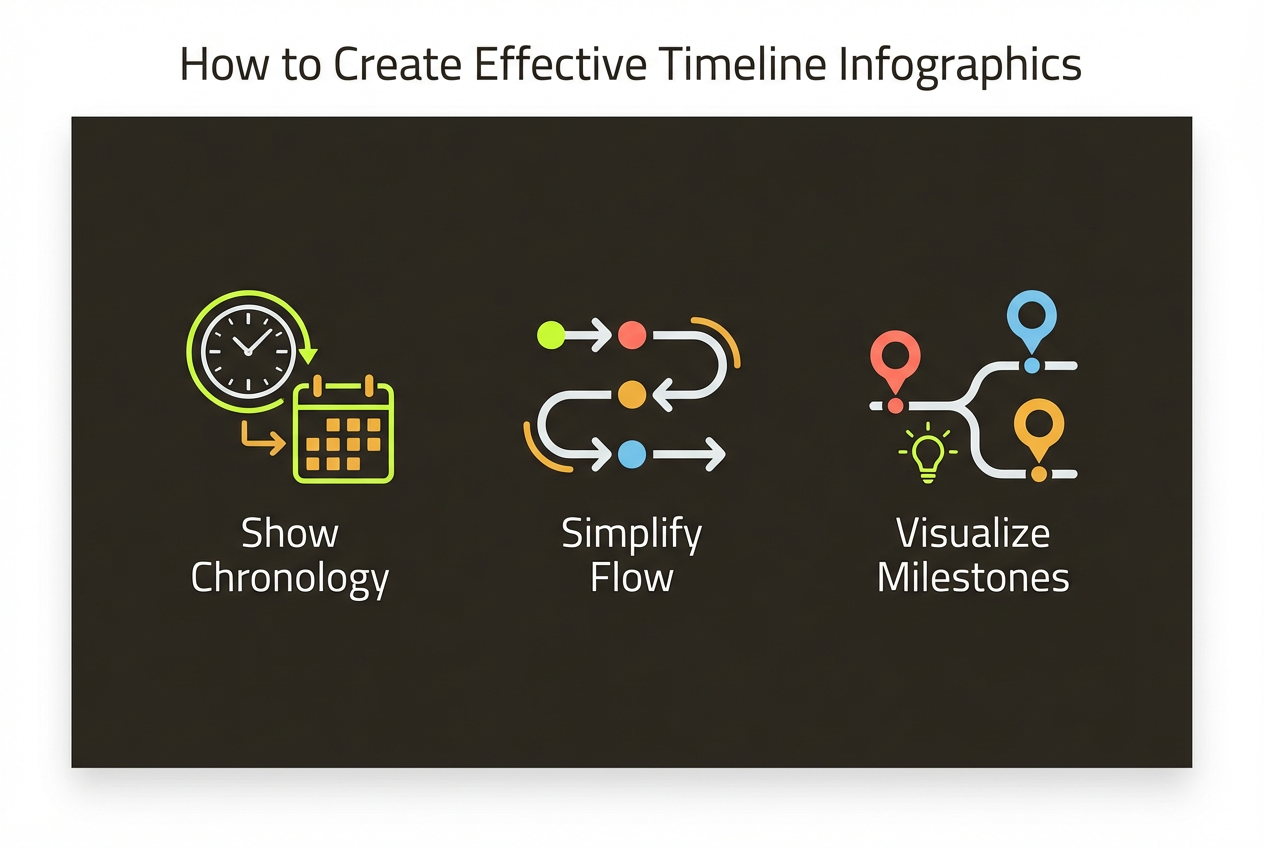
How to Create Effective Timeline Infographics
Master the art of visual timelines. Learn when to use them, design best practices, and how to make chronological information engaging and memorable.
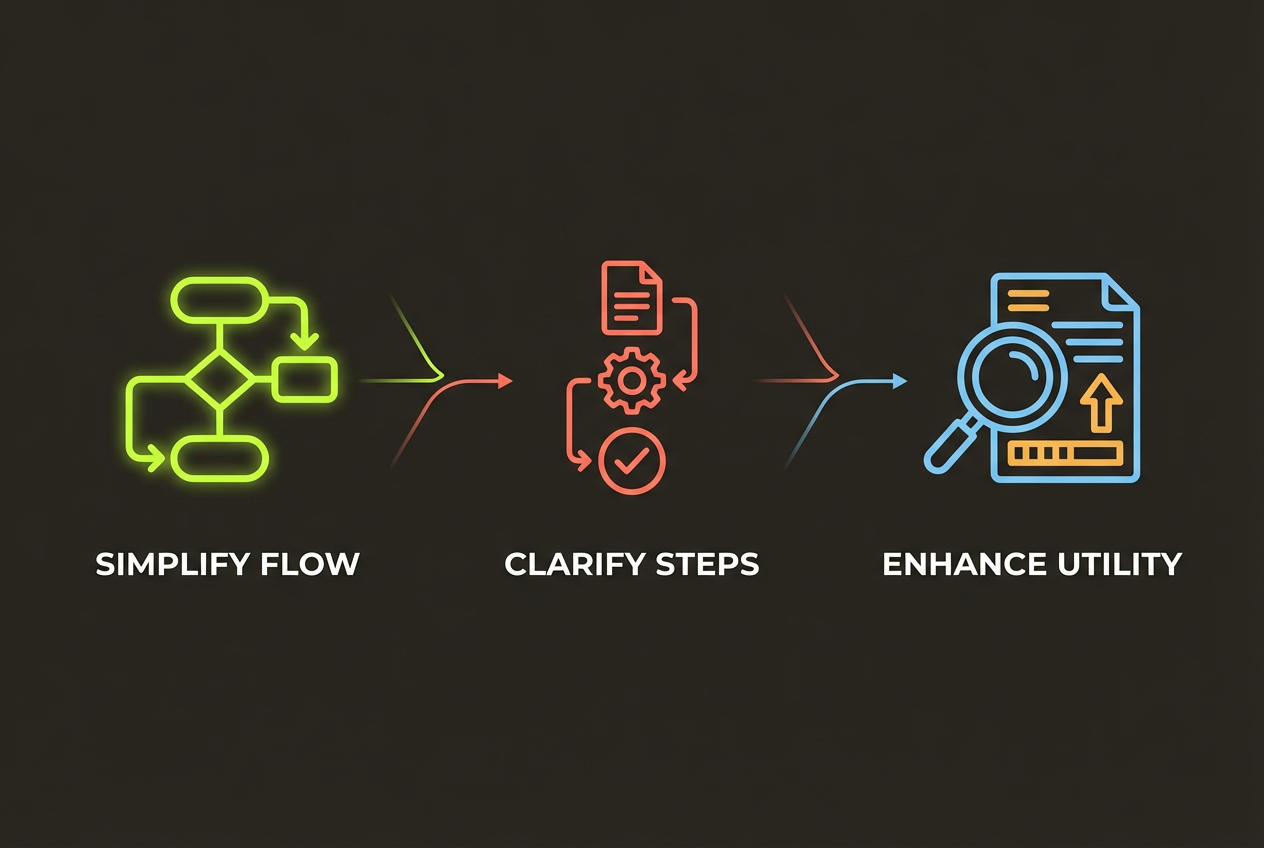
How to Design Process Infographics That Actually Help
Create clear, actionable process infographics for workflows, tutorials, and procedures. Learn step-by-step design principles that improve understanding.
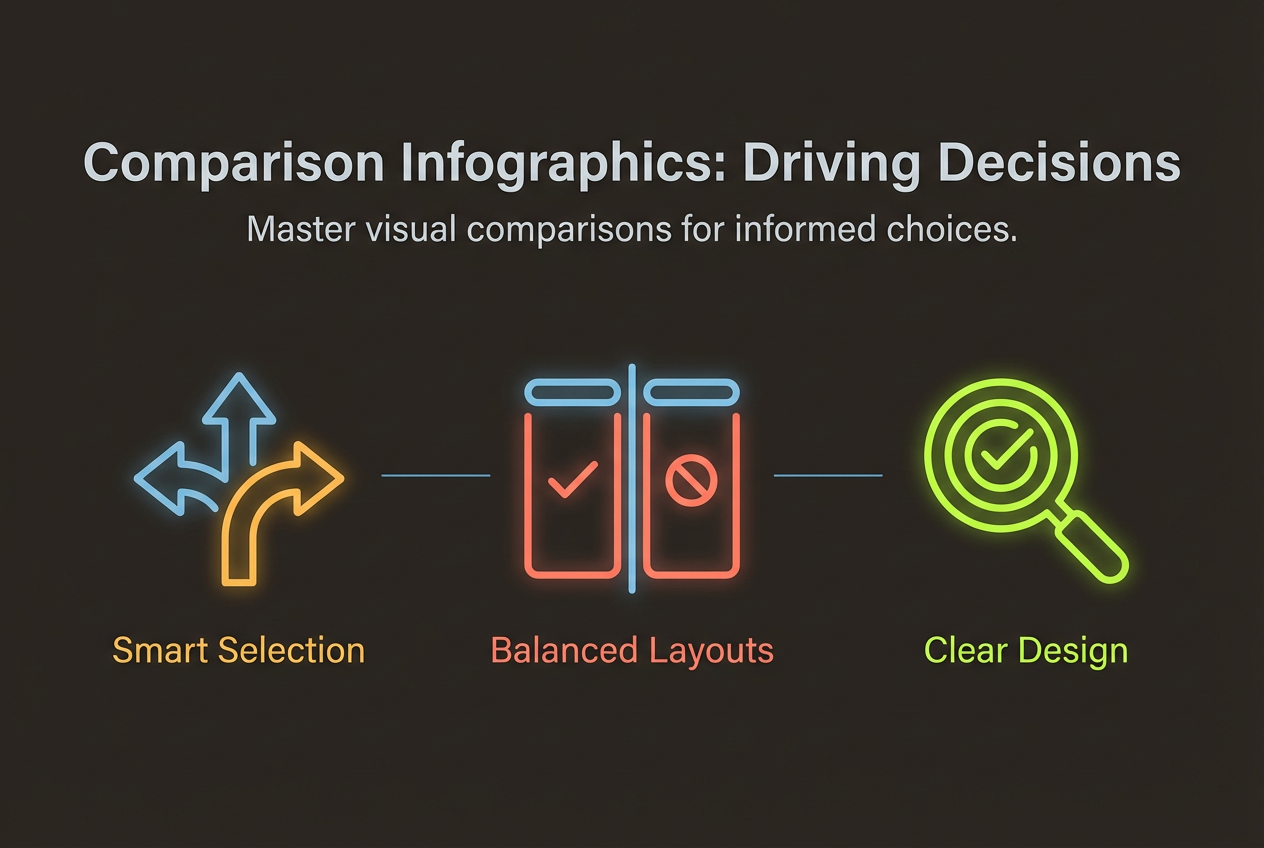
How to Create Comparison Infographics That Drive Decisions
Master the art of visual comparisons. Learn when to use comparison infographics, layout options, and design techniques that help audiences make informed decisions.
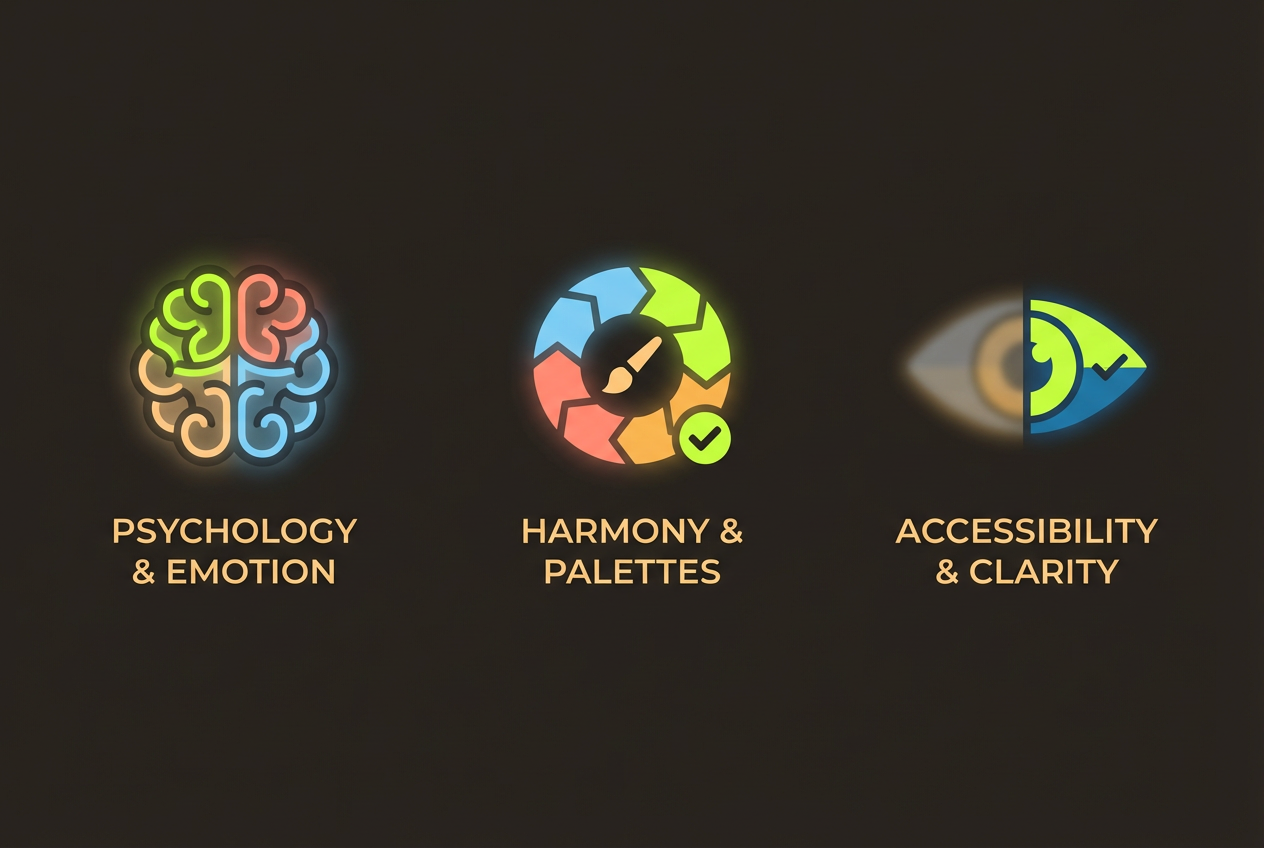
Color Theory for Infographics: A Practical Guide
Master color choices for effective infographics. Learn color psychology, palette selection, accessibility considerations, and practical tips for non-designers.

Best Canva Alternatives for Infographics in 2026
Looking for Canva alternatives focused on infographic creation? Compare the top options for data visualization, AI generation, and enterprise features.