Why Presentations Need Infographics
Death by PowerPoint is real. Audiences tune out after slide after slide of bullet points. But presentations with visual data are 43% more persuasive and significantly more memorable.
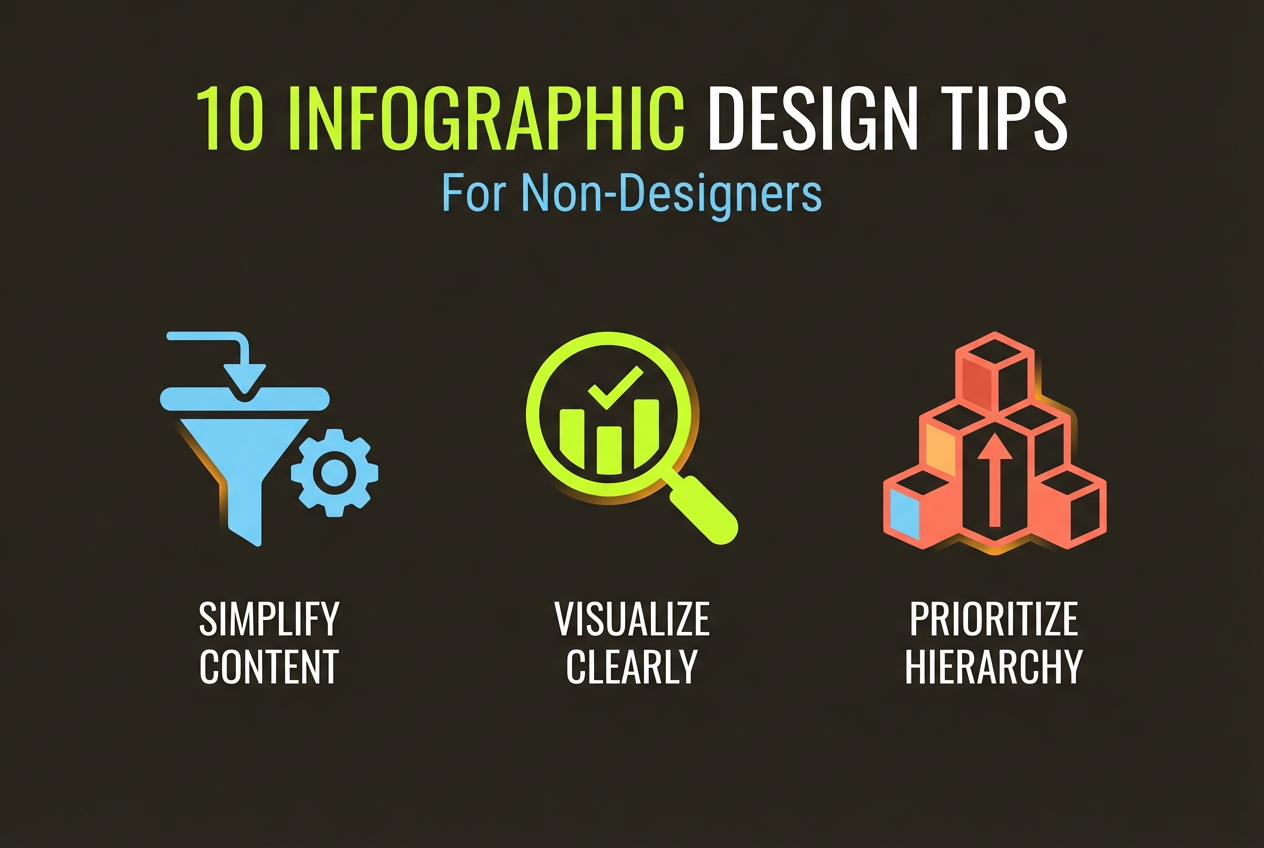
Infographics in presentations serve multiple purposes: they break up text monotony, make data digestible at a glance, and give audiences visual anchors to remember key points.
- Audiences retain 65% of visual information vs. 10% of text
- Visual presentations are processed 60,000x faster
- Infographic slides have 94% more views than text slides
- Decision-makers prefer visual summaries over detailed text
Strategic Placement
Don't scatter infographics randomly through your deck. Use them strategically at key moments.
Opening Hook
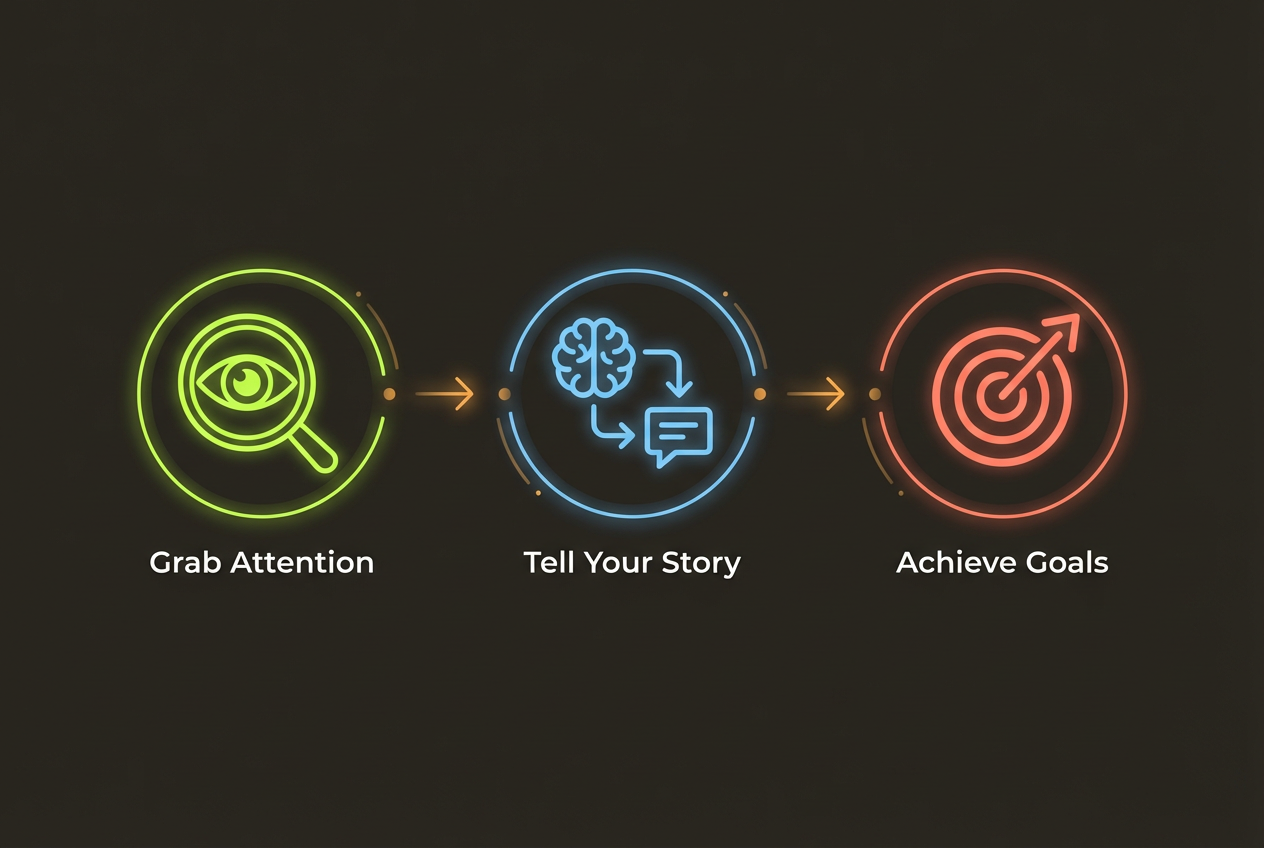
Start with a striking data point or visual that captures attention and establishes why your presentation matters. A single powerful statistic visualized memorably beats three bullet points every time.
Key Findings
Use infographics to present your most important data. These are the slides people will remember and reference later.
Summary Slides
Before transitions between sections or at the end, use visual summaries that reinforce key takeaways. These become the mental bookmarks your audience carries away.
Design for Slides
Slide infographics have different requirements than standalone infographics. They need to be simpler, larger, and optimized for projection.
- Use large fonts (minimum 24pt)—your slide will be viewed from across a room
- Limit to one main point per slide infographic
- Use high contrast colors that work on projectors
- Leave generous margins—don't crowd the edges
- Test on actual presentation equipment before presenting
Remember: you'll be talking through your slides. The infographic supports your narrative—it doesn't need to communicate everything on its own.
Presenting Data Visually
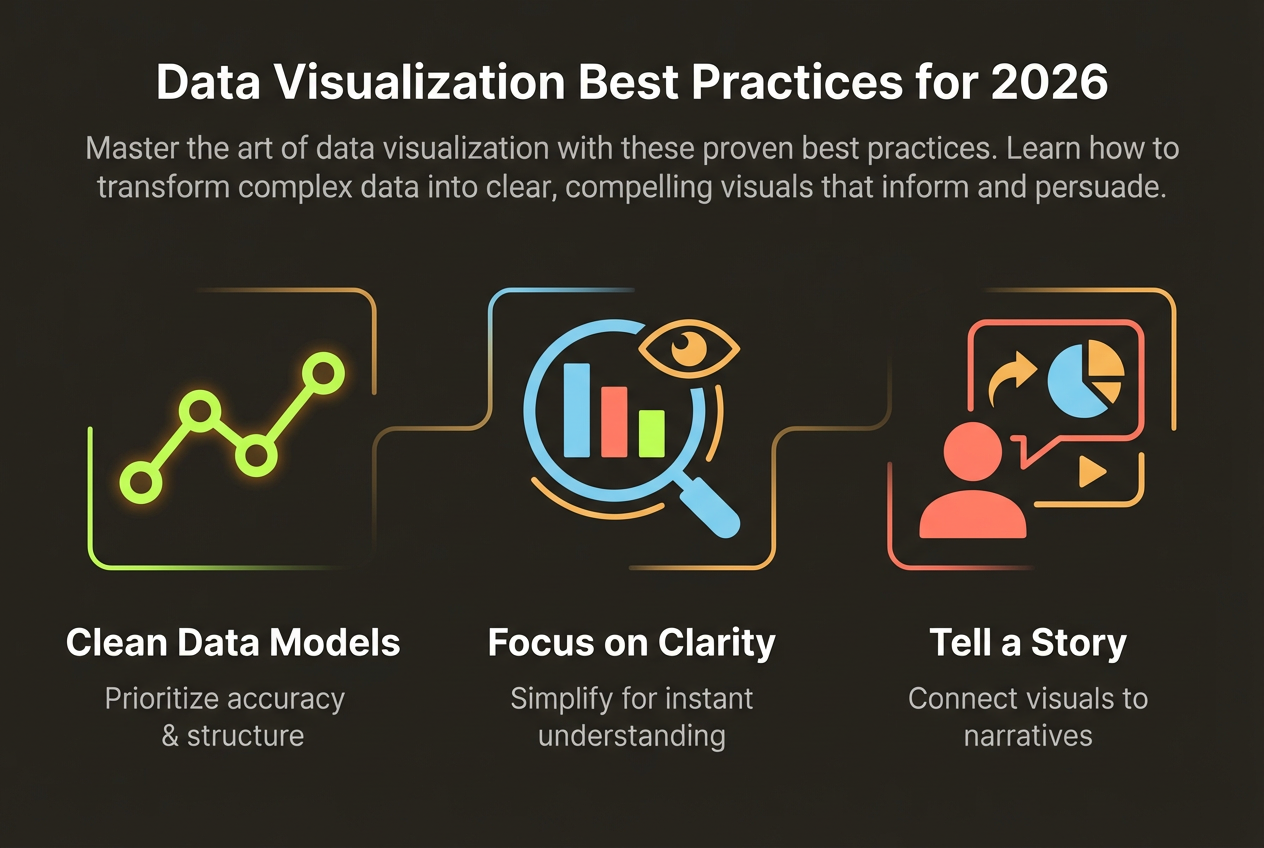
The most common presentation mistake is showing data tables when charts would be clearer. Transform your data for impact.
- Replace tables with bar charts for comparisons
- Use line charts to show trends instead of listing numbers
- Highlight the key metric with a large number callout
- Use icons and illustrations to make abstract concepts concrete
- Animate chart builds to guide attention (sparingly)
Create Presentation-Ready Infographics
InfoArt.ai generates infographics sized perfectly for presentations. Export directly to PNG or embed in PowerPoint.
Create Free InfographicTools and Workflow
The most efficient workflow separates infographic creation from slide assembly. Create your visuals in a specialized tool, then import into your presentation software.
- Draft your presentation outline and identify data visualization opportunities
- Gather the specific data points you need to visualize
- Create infographics in an AI tool like InfoArt.ai
- Export as high-resolution PNG files
- Import into PowerPoint, Keynote, or Google Slides
- Add any final text overlays or animations in the presentation tool
This workflow gives you the best of both worlds: professional-quality visuals with the flexibility of your preferred presentation software.