Start with a Clear Hierarchy
Visual hierarchy is the foundation of effective design. It guides your reader's eye from the most important information to supporting details in a natural, intuitive flow.
Think of your infographic as a newspaper front page. The headline grabs attention, subheadings provide context, and body text delivers details. Apply the same principle: make your main message impossible to miss.
- Make your title 2-3x larger than body text
- Use size, color, and position to emphasize key points
- Group related information together visually
- Create a clear reading path from top to bottom
Embrace White Space
Non-designers often try to fill every pixel with content. Resist this urge. White space (empty space) is a powerful design element that improves readability and creates a professional look.
White space is like air: you don't notice it until there's not enough. Give your content room to breathe.
- Add generous margins around the edges
- Space sections apart with clear visual breaks
- Don't crowd text around images or charts
- When in doubt, remove something rather than adding more
Limit Your Color Palette
One of the fastest ways to make your infographic look amateur is using too many colors. Professional designers typically work with 2-4 colors, creating variety through shades and tints.
- Choose one primary color for emphasis and key elements
- Select one or two secondary colors for supporting elements
- Use neutral colors (gray, black, white) for text and backgrounds
- Create variations through 20%, 40%, 60% opacity versions
If you're unsure about color choices, start with your brand colors or use a tool like Coolors to generate harmonious palettes.
Choose Fonts Wisely
Typography can make or break your infographic. The good news? You only need two fonts: one for headlines and one for body text.
- Headlines: Bold sans-serif fonts like Montserrat, Poppins, or Inter
- Body text: Clean, readable fonts like Open Sans, Lato, or Roboto
- Avoid decorative or script fonts—they're hard to read
- Maintain consistent sizing throughout (don't use 10 different sizes)
Ensure sufficient contrast between text and background. Dark text on light backgrounds is easiest to read for longer content.
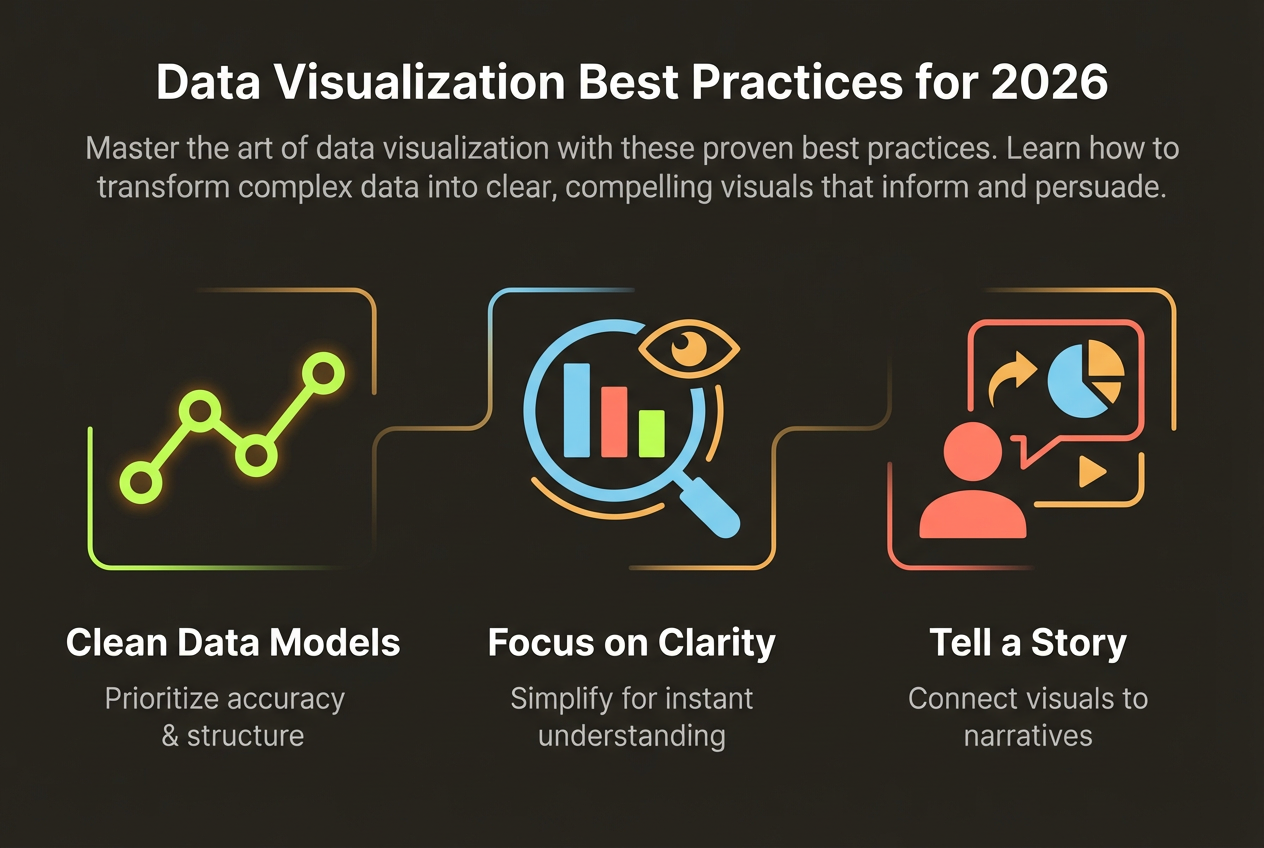
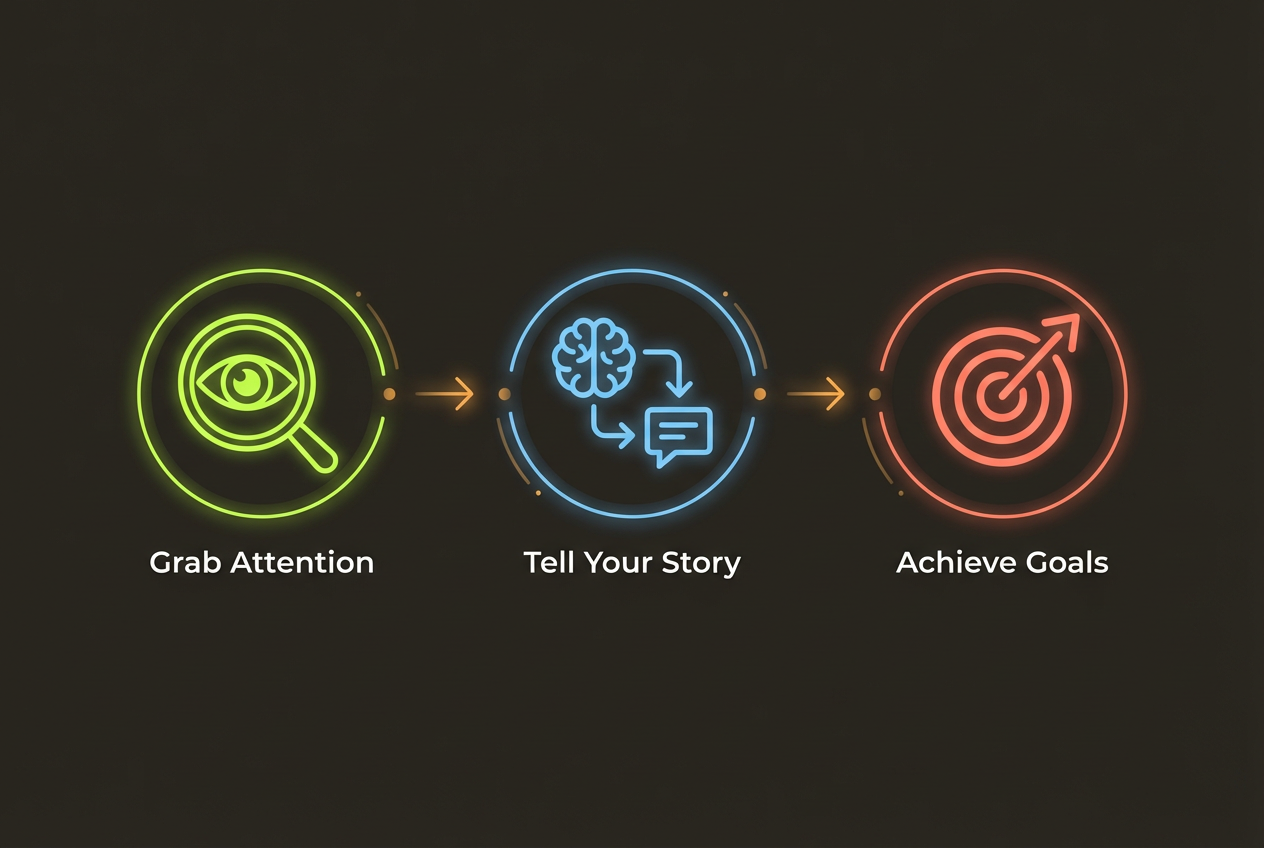
Use Icons Consistently
Icons add visual interest and help communicate concepts quickly. But mixing icon styles is a common mistake that makes infographics look unprofessional.
- Stick to one icon style throughout (outlined, filled, or glyph)
- Use icons from the same family or set
- Keep icon sizes consistent
- Don't over-icon—use them to support, not replace, text
Let AI Handle the Design
InfoArt.ai automatically applies professional design principles. Just describe your content, and AI creates polished infographics instantly.
Create Your First Infographic