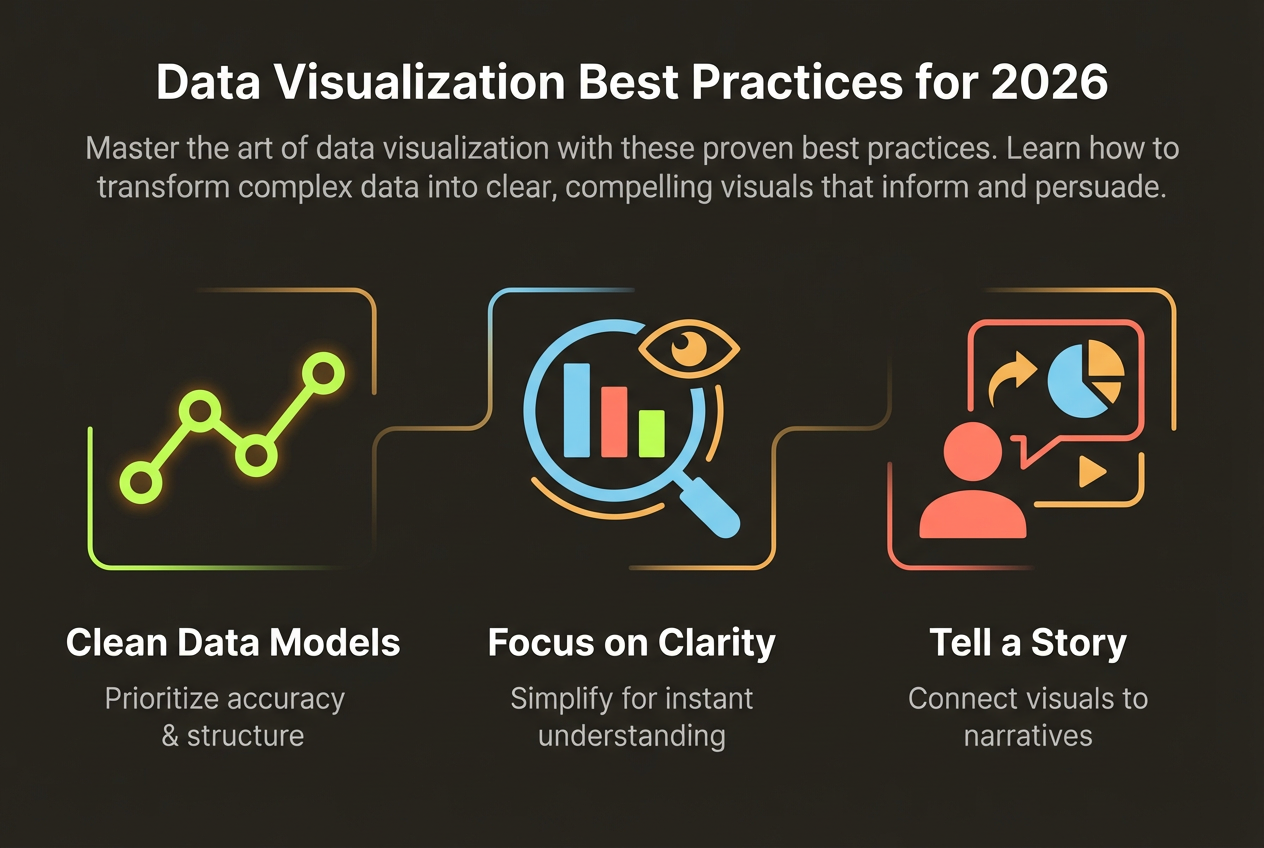
Why Visualization Matters in Finance
Financial data is complex by nature. Balance sheets, cash flow statements, and portfolio analytics contain crucial information that stakeholders need to understand and act upon. Visualization transforms this complexity into clarity.
Effective financial visualization serves multiple purposes: it helps executives make faster decisions, enables investors to grasp performance at a glance, and satisfies regulatory requirements for clear disclosure.
- Board members prefer visual financial summaries over spreadsheet details
- Investors spend 80% more time on reports with strong visuals
- Financial errors decrease when data is visualized for review
- Regulatory bodies increasingly expect clear visual disclosure
Compliance and Accuracy
In finance, visualization isn't just about communication—it's about accuracy and compliance. Misleading charts can have legal consequences.
Non-Negotiable Rules
- Always start y-axes at zero for bar charts showing financial values
- Never use perspective or 3D effects that distort perception
- Include time periods and currencies clearly labeled
- Show pro forma vs. GAAP distinctions when applicable
- Include disclaimers and forward-looking statement warnings where required
In financial visualization, clarity isn't just good design—it's a fiduciary responsibility.
Chart Types for Financial Data
Different financial metrics call for different visualization approaches. Here are the most effective choices.
Revenue and Profit Trends
Line charts excel at showing financial trends over time. Use multiple lines to compare metrics (revenue vs. profit) or entities (company vs. benchmark). Area charts emphasize magnitude.
Composition and Allocation
Stacked bar charts and treemaps show how totals break down into components—ideal for expense allocation, revenue by segment, or portfolio composition.
Comparisons
Horizontal bar charts work well for comparing financial metrics across peers, time periods, or business units. They accommodate long labels and make differences clear.
Variance and Change
Waterfall charts are uniquely suited to showing how a starting value changes through additions and subtractions to reach an ending value—perfect for explaining profit bridges or budget variances.
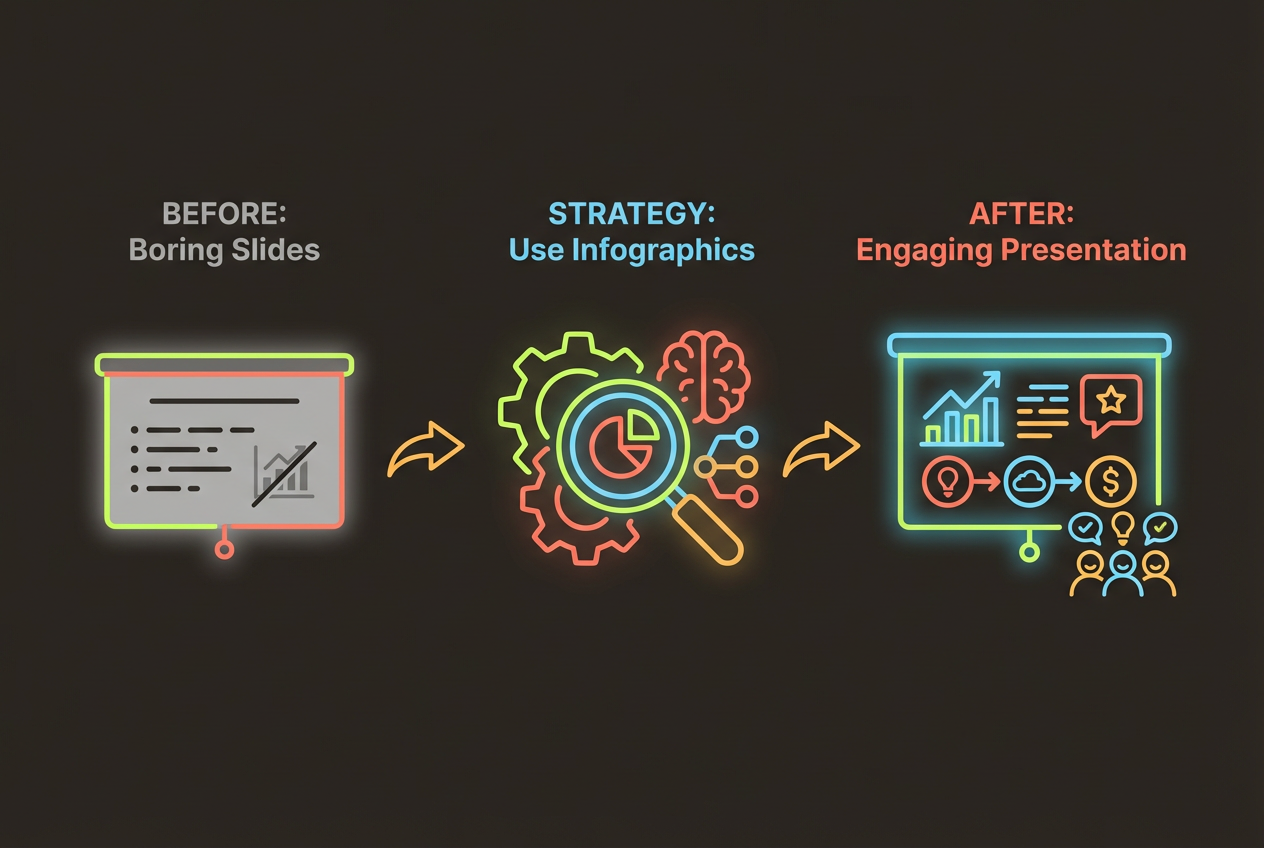
Designing for Different Audiences
Financial visualizations serve diverse audiences with different needs. Tailor your approach accordingly.
Board and Executive Presentations
Focus on strategic insights and key metrics. Executives want the story, not the details. Use dashboard-style layouts with 4-6 key metrics prominently displayed.
Investor Communications
Balance clarity with completeness. Investors need enough detail to make decisions but appreciate visual summaries. Always include comparable periods and benchmarks.
Internal Analysis
Financial analysts need more granular visualizations that support deep analysis. Interactive dashboards with drill-down capabilities are ideal for internal use.
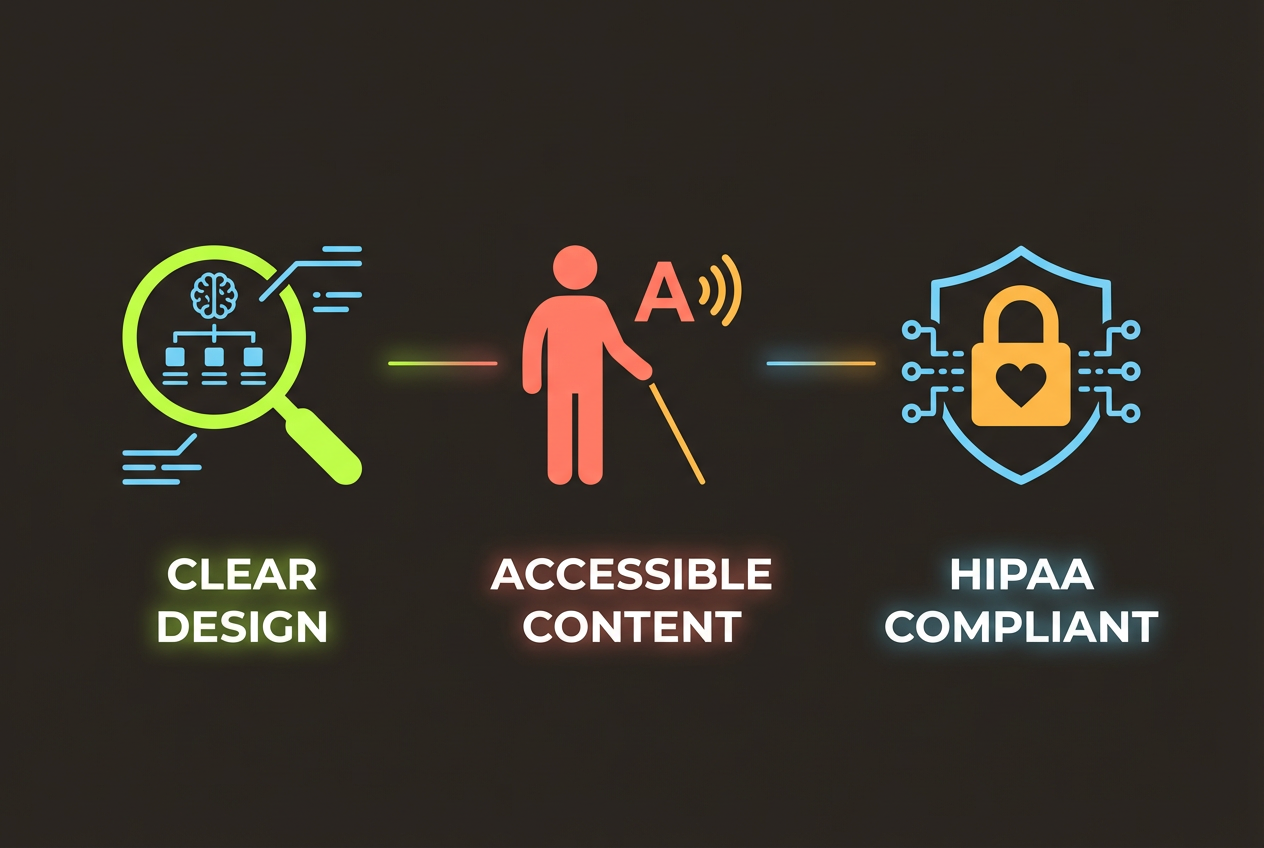
Tools and Security
Financial data requires careful handling. The tools you use for visualization must meet security and compliance requirements.
- Use tools with SOC 2 compliance for financial data
- Verify data handling policies—ensure no training on your data
- Check export capabilities meet your audit trail requirements
- Consider on-premise or private cloud options for sensitive data
- Maintain version control for regulatory documentation
Secure Financial Visualization
InfoArt.ai is designed with financial security in mind. Zero training guarantee means your financial data stays private.
Learn About Security