Transform Marketing Data Into Visual Stories
Create professional marketing report infographics that make your campaign results impossible to ignore. Turn spreadsheets into stakeholder-ready visuals in seconds.
The Marketing Report Struggle
Marketing teams spend hours turning data into presentations that still fail to capture attention.
Hours in Design Tools
Cobbling together charts in PowerPoint or fighting with Canva templates wastes valuable time that could be spent on strategy.
Data That Doesn't Tell a Story
Raw numbers and basic charts fail to communicate the impact of your campaigns to stakeholders and executives.
Inconsistent Brand Presentation
Every report looks different, undermining your team's professional image and making it hard to track trends over time.
Marketing Reports That Actually Get Read
InfoArt.ai transforms your marketing data into compelling visual narratives that executives actually engage with.
Campaign Performance Dashboards
Turn your Google Analytics, ad platform, and CRM data into beautiful, consolidated dashboards that tell the full story of your campaign performance.
ROI Visualization
Make budget conversations easier with clear visualizations that show exactly how marketing spend translates to results.
Automated Data Import
Upload your CSV exports from any marketing platform and let AI organize the data into meaningful visual hierarchies.
Brand-Consistent Output
Every infographic maintains professional quality, so your reports always represent your team well.
From Data to Dashboard in 3 Steps
Upload Your Data
Export your campaign data from Google Analytics, HubSpot, Salesforce, or any platform. Upload the CSV or paste key metrics directly.
Describe Your Story
Tell us what narrative you want to convey: campaign wins, quarterly trends, channel comparisons, or ROI analysis.
Get Presentation-Ready Visuals
Receive polished infographics ready for executive presentations, client reports, or team meetings.
InfoArt.ai vs. Traditional Report Creation
| Feature | InfoArt.ai | PowerPoint/Canva |
|---|---|---|
| Time to create report visual | 30 seconds | 2-4 hours |
| Automatic data visualization | ||
| AI-powered layout optimization | ||
| Consistent quality every time | ||
| Design skills required | ||
| Works with raw CSV data |
Why Marketing Teams Choose InfoArt.ai
Save Hours Every Week
Stop spending time on design. Create all your weekly, monthly, and quarterly reports in minutes instead of hours.
Impress Stakeholders
Professional-quality visuals make your results stand out and your recommendations more persuasive.
Data Stays Private
Your campaign data, client information, and business metrics are never used to train AI models. Enterprise-grade security.
Export Anywhere
Download PNG or PDF formats perfect for PowerPoint, Google Slides, email, or printed reports.
Example Marketing Infographics
See what you can create for your next marketing report.
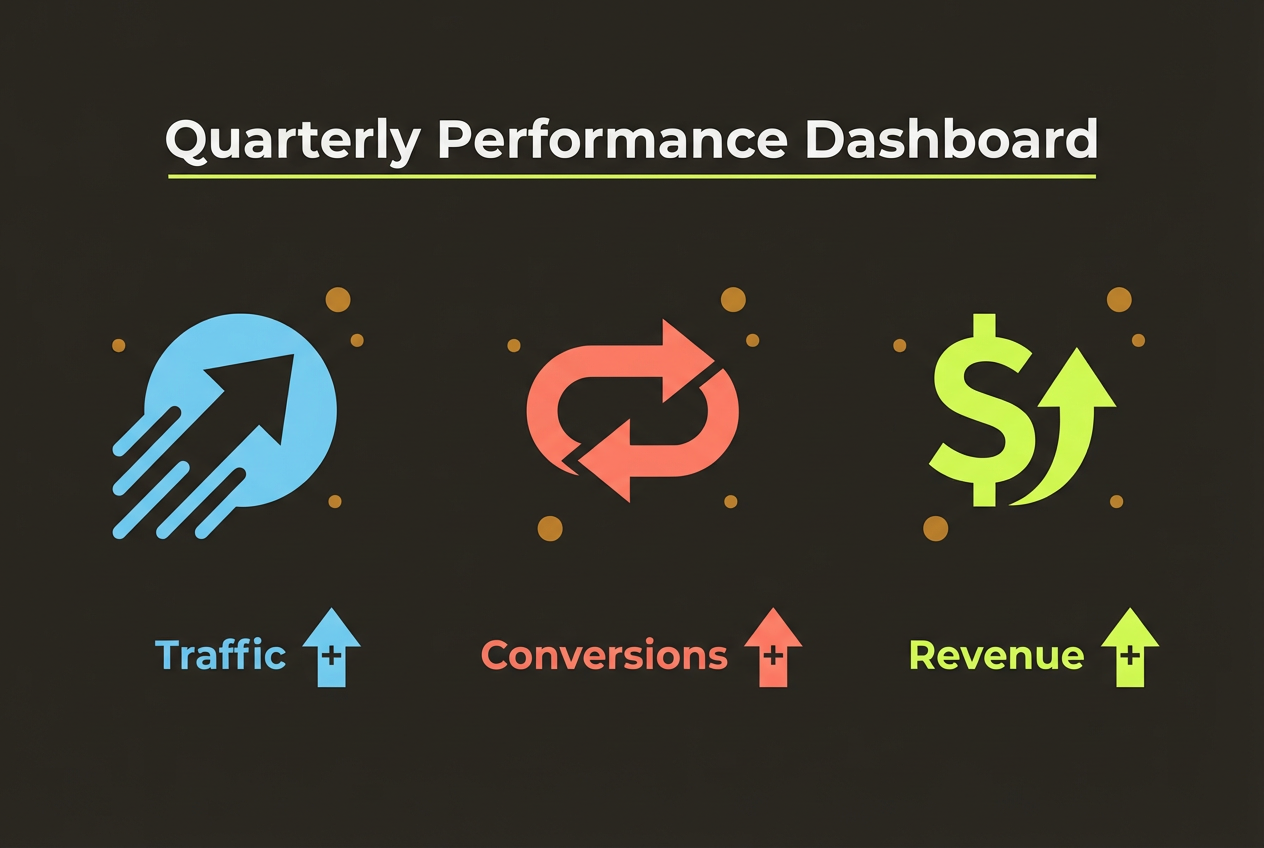
Quarterly Performance Dashboard
Traffic, conversions, and revenue at a glance with trend indicators.
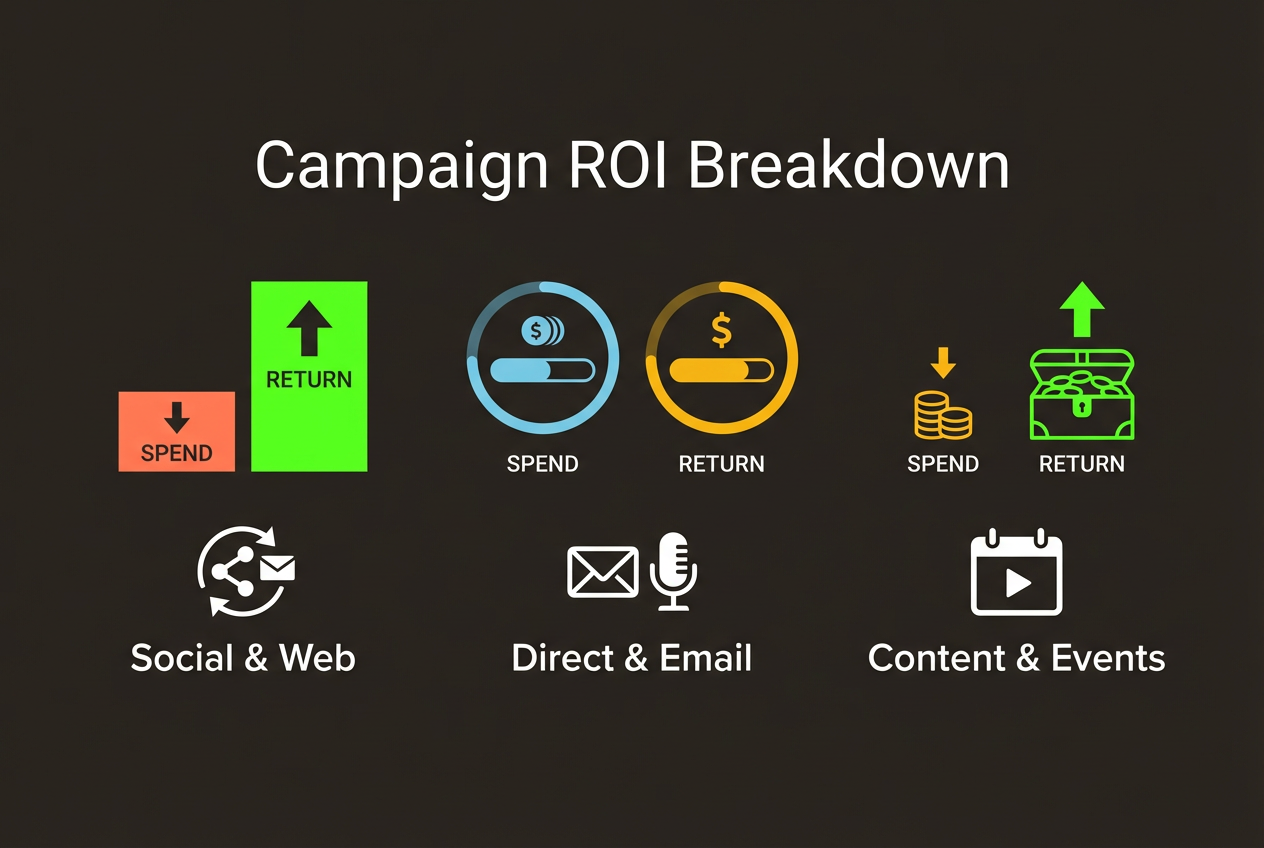
Campaign ROI Breakdown
Channel-by-channel spend and return visualization.
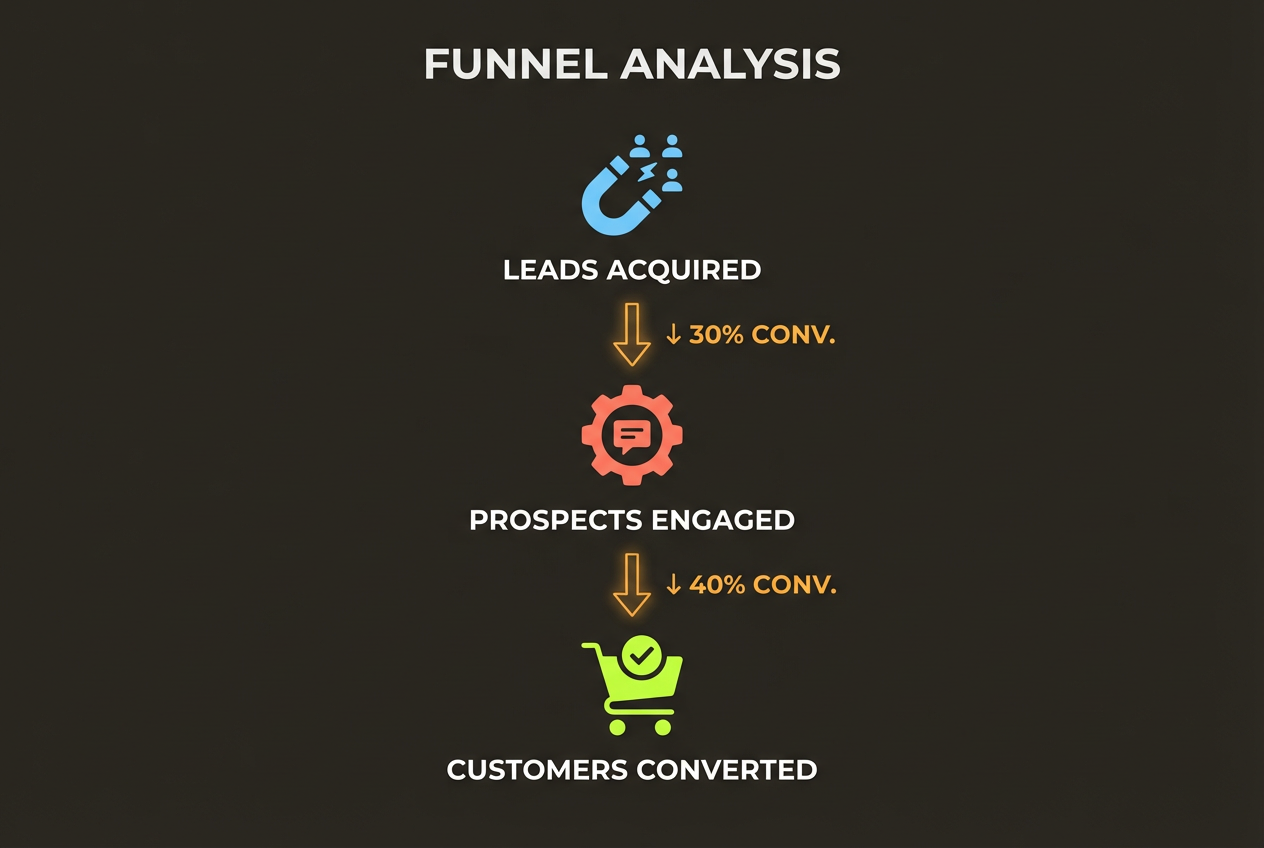
Funnel Analysis
Lead-to-customer journey with conversion rates at each stage.
Frequently Asked Questions
Ready to Transform Your Marketing Reports?
Join marketing teams creating stunning report visuals in seconds instead of hours.
Free to start. No credit card required.