Turn Raw Data Into Visual Stories
Transform spreadsheets, databases, and CSV files into stunning data visualizations that make complex information instantly understandable. No design skills required.
The Data Visualization Challenge
You have valuable data, but turning it into compelling visuals is harder than it should be.
Excel Charts Fall Flat
Default spreadsheet charts are boring and fail to capture attention. They look like every other chart your audience has seen.
Design Tools Are Complex
Professional visualization tools like Tableau or D3.js have steep learning curves and require technical expertise your team may not have.
Manual Work Doesn't Scale
Creating custom visualizations for every dataset takes hours. When data updates, you have to start over.
AI-Powered Data Visualization
InfoArt.ai understands your data and automatically creates the right visualizations to tell your story.
Smart Data Interpretation
Upload your CSV or paste your data. Our AI analyzes the structure, identifies patterns, and suggests the best visualization types.
Multiple Chart Types
Bar charts, line graphs, pie charts, scatter plots, and more. InfoArt.ai chooses the right format for your data—or you can specify exactly what you want.
Context-Aware Design
Tell us what story you want to tell, and AI creates visualizations that emphasize the right data points and trends.
Instant Iteration
Don't like the first result? Describe what you want differently and get a new visualization in seconds.
From Spreadsheet to Stunning Visual
Upload Your Data
Drop in a CSV file, paste data from Excel, or type in key numbers you want to visualize. Works with any tabular data format.
Describe Your Goal
Tell us what insight you want to highlight: trends over time, comparisons between categories, distribution patterns, or relationships in your data.
Get Beautiful Visualizations
Receive professional data visualizations optimized for presentations, reports, and sharing. Iterate until it's perfect.
InfoArt.ai vs. Traditional Data Viz Tools
| Feature | InfoArt.ai | Excel/Tableau |
|---|---|---|
| Time to create visualization | 30 seconds | 30+ minutes |
| Design skills required | ||
| Automatic chart type selection | ||
| Natural language input | ||
| Presentation-ready output | Requires formatting | |
| Works with any CSV data | ||
| Learning curve | None | Hours to weeks |
Why Teams Choose InfoArt.ai for Data Visualization
Anyone Can Create Visualizations
No need for data analysts or designers. Anyone on your team can turn data into professional visuals.
Consistent Quality
Every visualization meets professional standards. No more inconsistent charts across different team members.
Data Security
Your sensitive business data is never used for AI training. Enterprise-grade encryption and privacy controls.
Works With Your Data Sources
Export from Excel, Google Sheets, databases, or any tool that produces CSV. InfoArt.ai handles the rest.
Data Visualization Examples
See how InfoArt.ai transforms different types of data into clear visualizations.
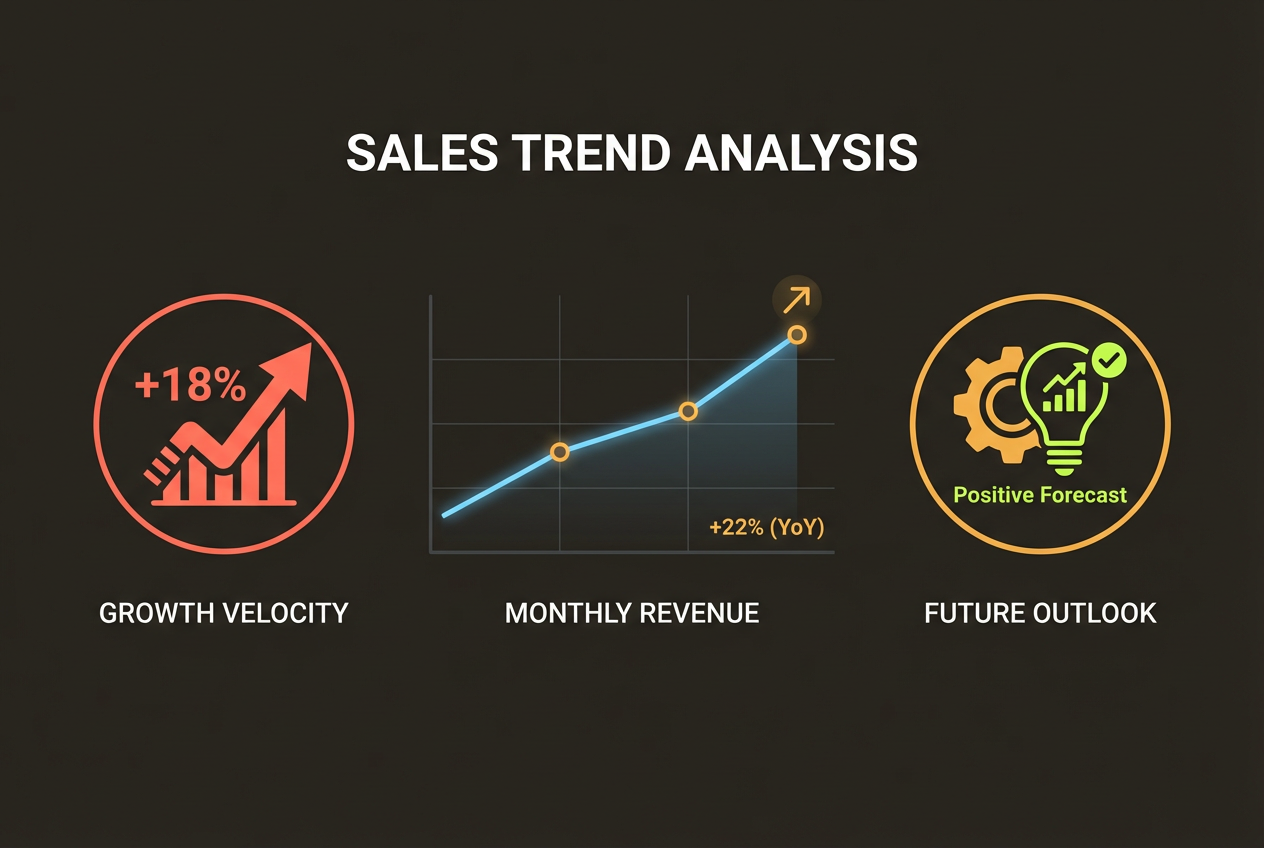
Sales Trend Analysis
Monthly revenue data transformed into a compelling trend visualization with growth indicators.
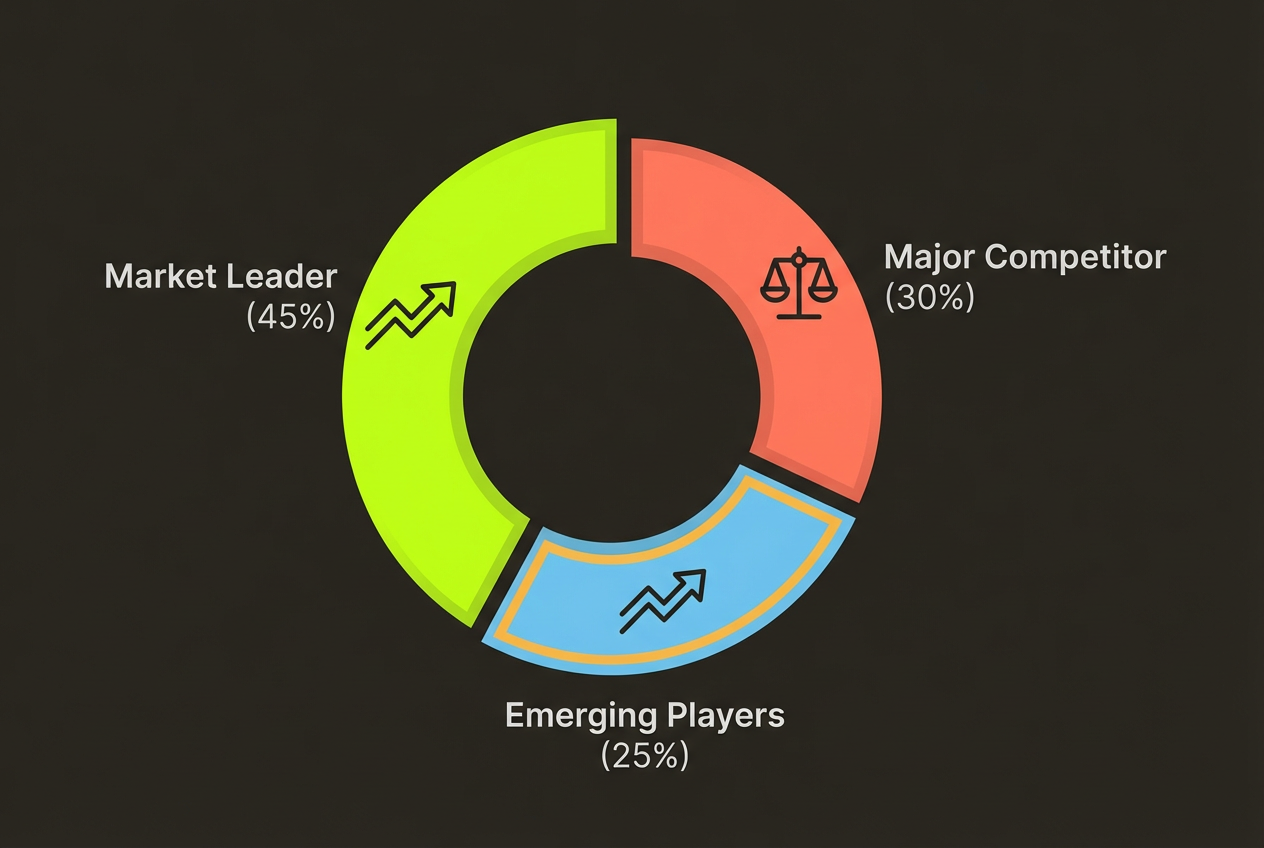
Market Share Breakdown
Competitive landscape data shown as an intuitive pie or donut chart with clear labeling.

Performance Comparison
Multi-variable data displayed as grouped bar charts that make comparisons obvious.
Frequently Asked Questions
Ready to Transform Your Data?
Upload your first dataset and see your data come to life in seconds.
Free to start. No credit card required.