Executive Reports That Get Read
Transform dense business data into clear, compelling visualizations that executives actually engage with. Make your quarterly reports, board decks, and KPI summaries impossible to ignore.
The Business Reporting Problem
Important business insights get buried in reports that nobody reads.
Reports That Collect Dust
You spend hours compiling data, but executives skim the summary and ignore the details. Your insights never drive action.
Spreadsheet Overload
Tables and numbers don't tell stories. Leadership can't quickly grasp what's working, what's not, and what needs attention.
Inconsistent Quality
Different teams produce reports that look completely different. There's no unified view of business performance.
Reports That Drive Decisions
InfoArt.ai transforms your business data into visual stories that leadership teams actually use.
Executive Dashboards
Create one-page visual summaries that give executives everything they need at a glance. Key metrics, trends, and insights—beautifully organized.
Quarterly Performance Visuals
Transform Q1, Q2, Q3, Q4 data into compelling before/after comparisons, trend lines, and achievement highlights.
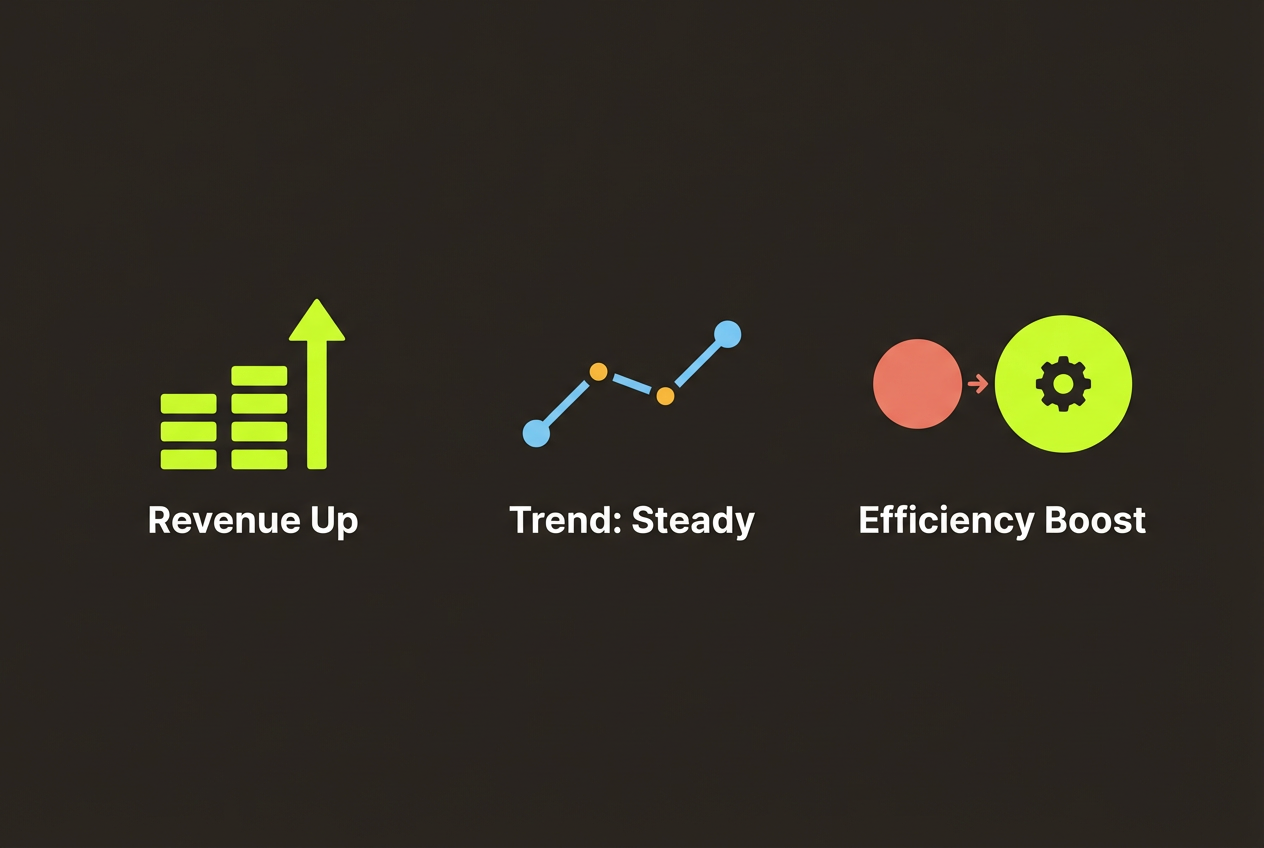
KPI Scorecards
Turn your key performance indicators into visual scorecards with clear status indicators and progress tracking.
Board-Ready Presentations
Create polished visuals that meet the professional standards expected in boardroom presentations.
From Data to Decision-Ready
Input Your Business Data
Upload your quarterly numbers, KPIs, or performance metrics. Paste from Excel or type key figures directly.
Define Your Focus
Tell us what story matters: revenue growth, cost reduction, market expansion, team performance, or operational efficiency.
Get Executive-Ready Visuals
Receive polished infographics designed for leadership consumption. Clear, professional, and actionable.
InfoArt.ai vs. Traditional Reporting
| Feature | InfoArt.ai | Excel/PowerPoint |
|---|---|---|
| Time to create report visual | 30 seconds | 2-4 hours |
| Executive-optimized layout | ||
| Automatic insight highlighting | ||
| Consistent across departments | ||
| Design expertise required | ||
| Board-ready quality | Varies |
Why Business Teams Choose InfoArt.ai
Reports That Get Attention
Visual reports are 43% more persuasive. When leadership can see the story, they're more likely to act on it.
Hours Saved Every Cycle
Stop spending days on quarterly report formatting. Create all your visuals in minutes.
Unified Business View
Every department's reports share consistent quality and style, making cross-functional insights easier to synthesize.
Confidential Data Security
Your financial data, strategic metrics, and business intelligence never train AI models. Enterprise-grade protection.
Business Report Examples
See what you can create for your next executive meeting.
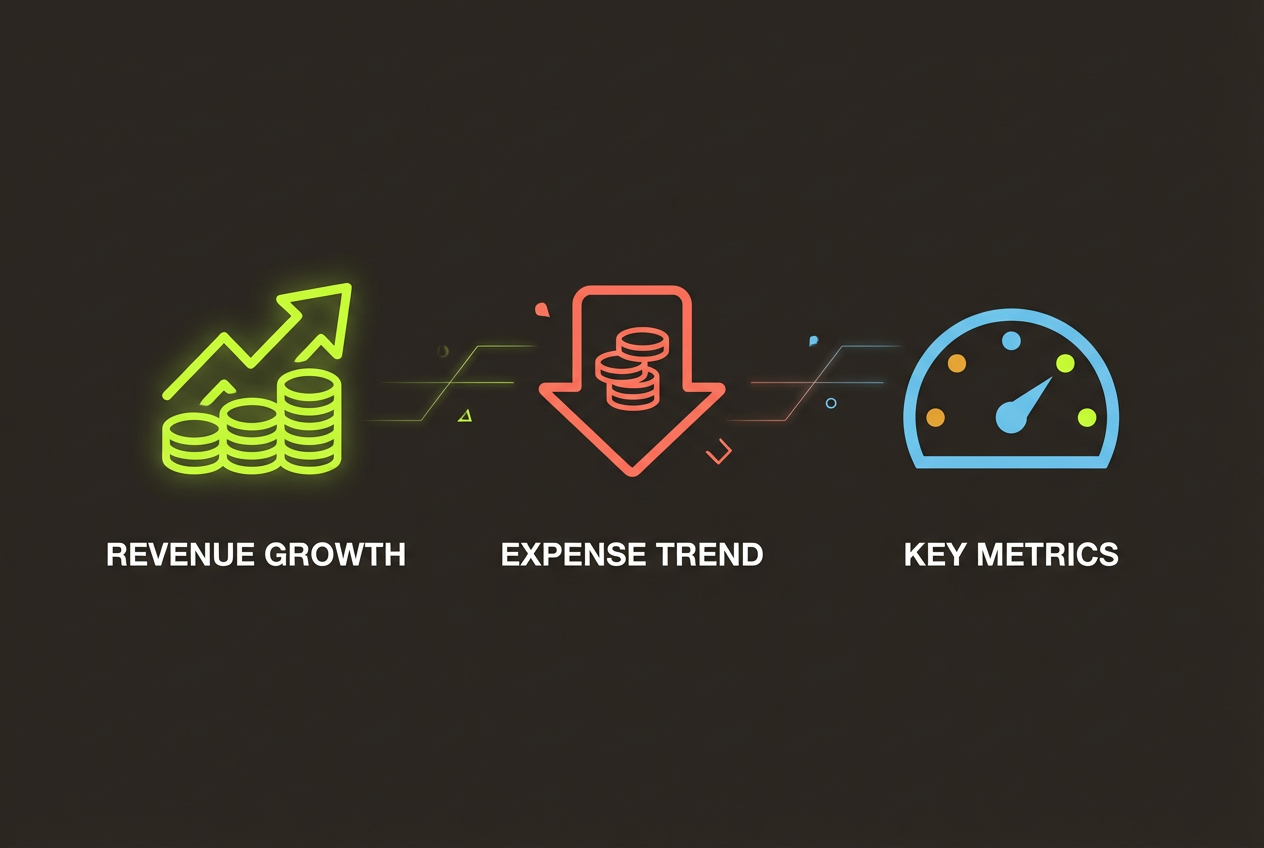
Quarterly Dashboard
Revenue, expenses, and key metrics in one comprehensive visual overview.
YoY Comparison
Year-over-year performance visualization with growth indicators and trend analysis.
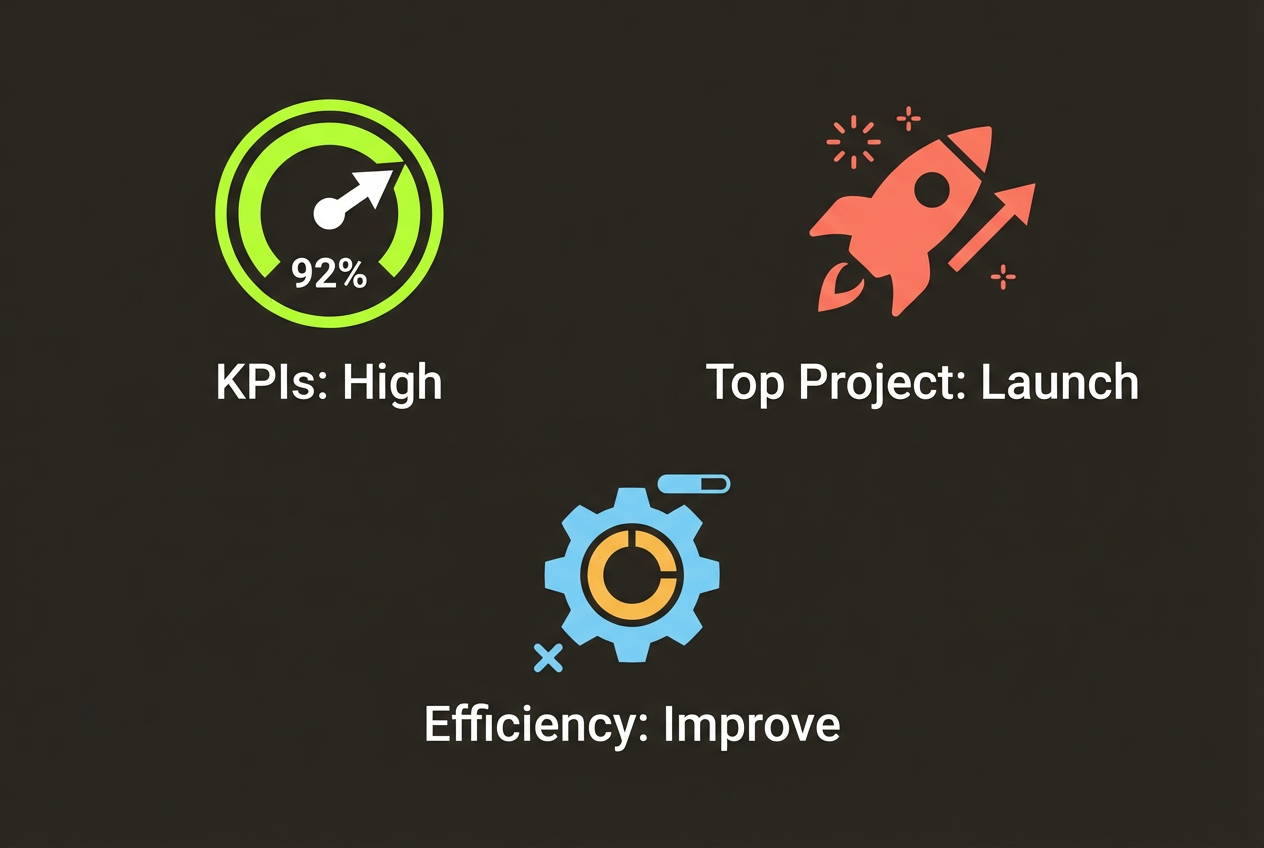
Department Scorecard
Team or division performance summary with KPI status and highlights.
Frequently Asked Questions
Ready to Transform Your Business Reports?
Create executive-ready visualizations that drive decisions.
Free to start. No credit card required.